
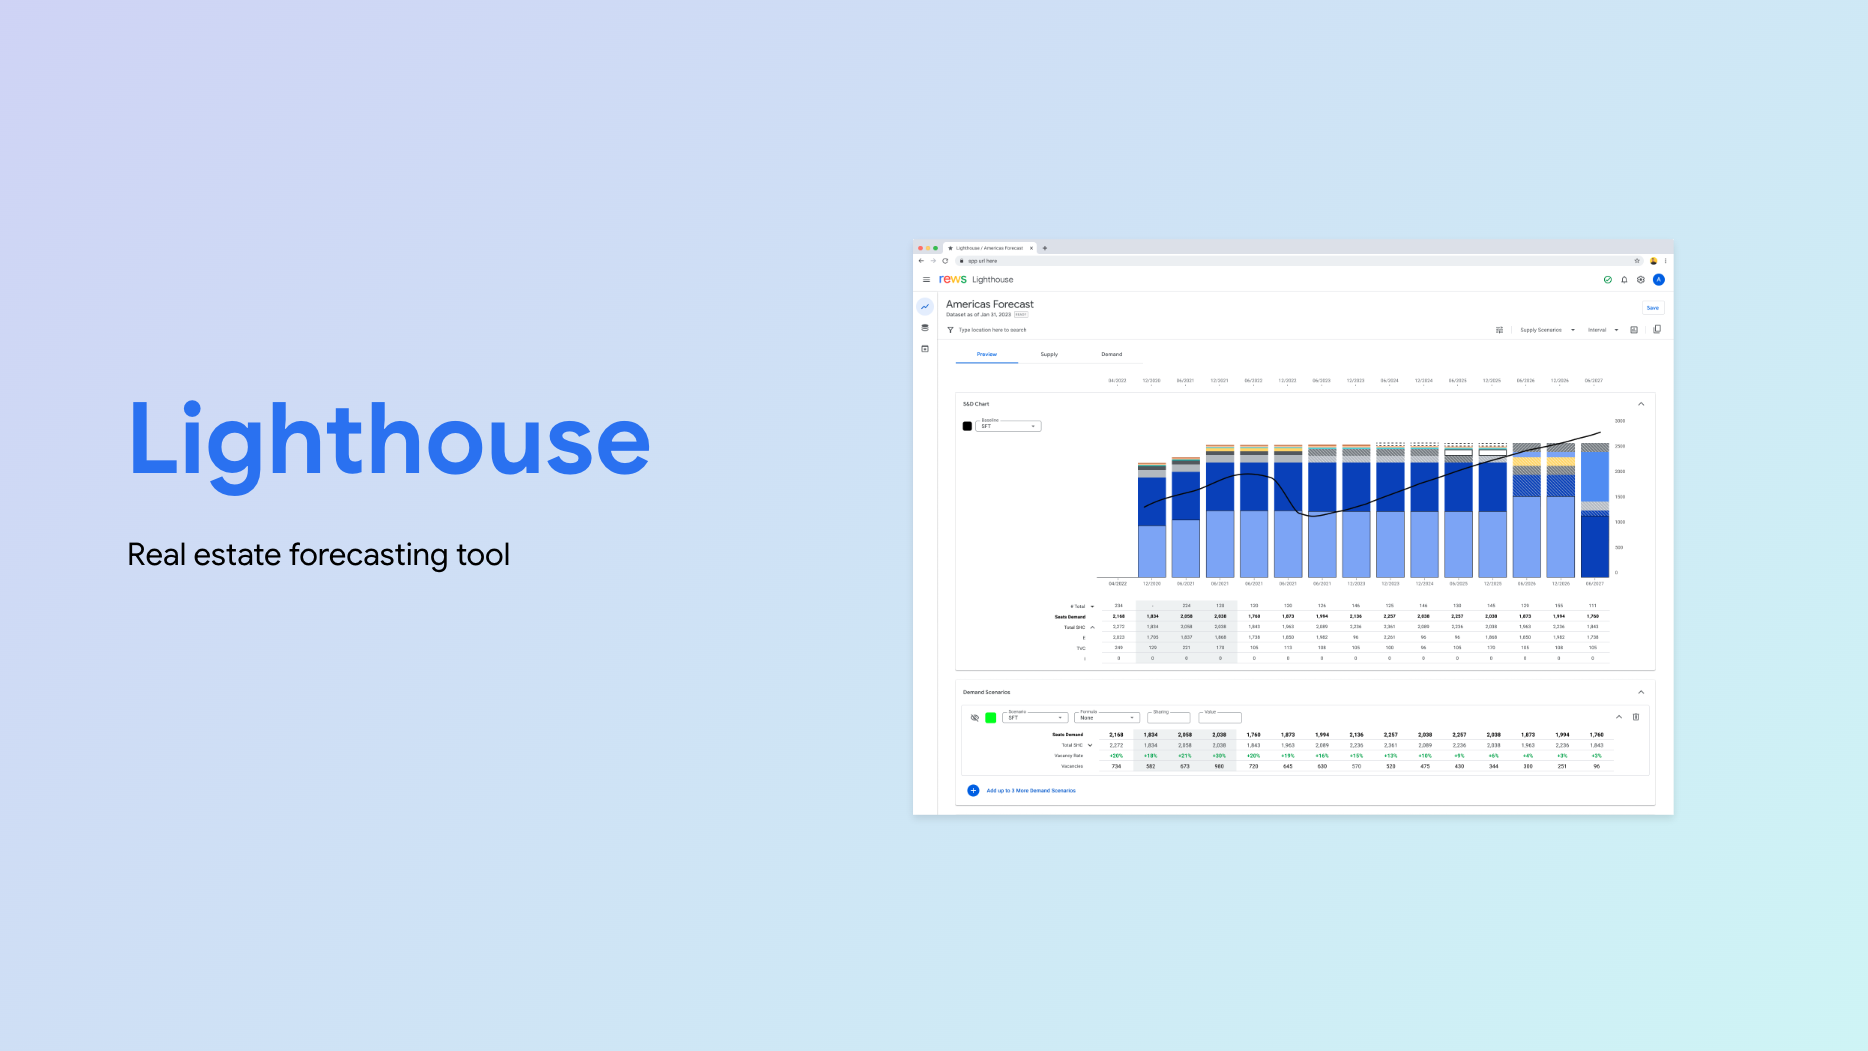
Lighthouse — Real Estate Forecasting Tool
An internal strategic planning platform at Google that helps real estate planners make data-driven choices about leasing, buying, extending, or ending property leases — grounded in 10-year headcount forecasts.
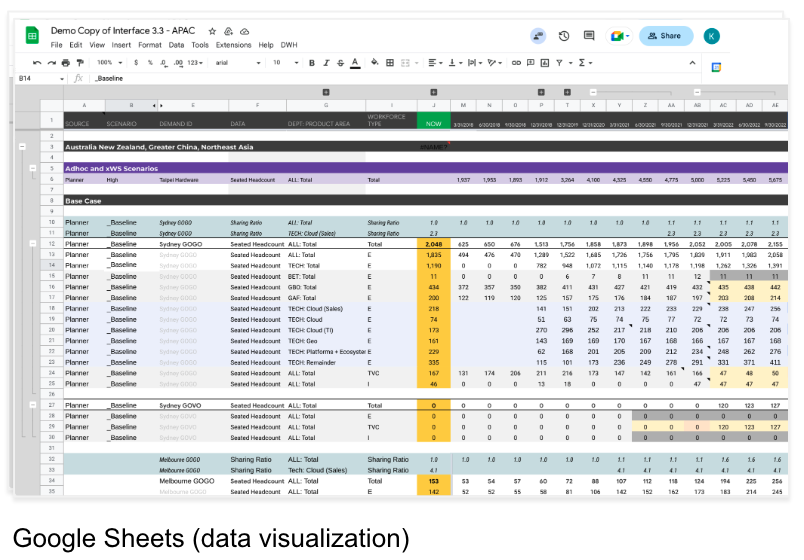
Problem: Global portfolio planning lived in fragile, manual Google Sheets — hard to validate, harder to forecast across regions, teams, and lease timelines. This led to data issues and slow decisions.
Approach: Keep Sheets as the source of truth; add a structured UI for Dataset, Plan, and Forecast; introduce validation rules, scenario modeling, and decision-ready readouts for better org alignment.
Outcome: Faster decisions with clearer trade-offs, fewer data issues, and a repeatable cadence for quarterly/annual planning — with zero new tool adoption burden.
The Product
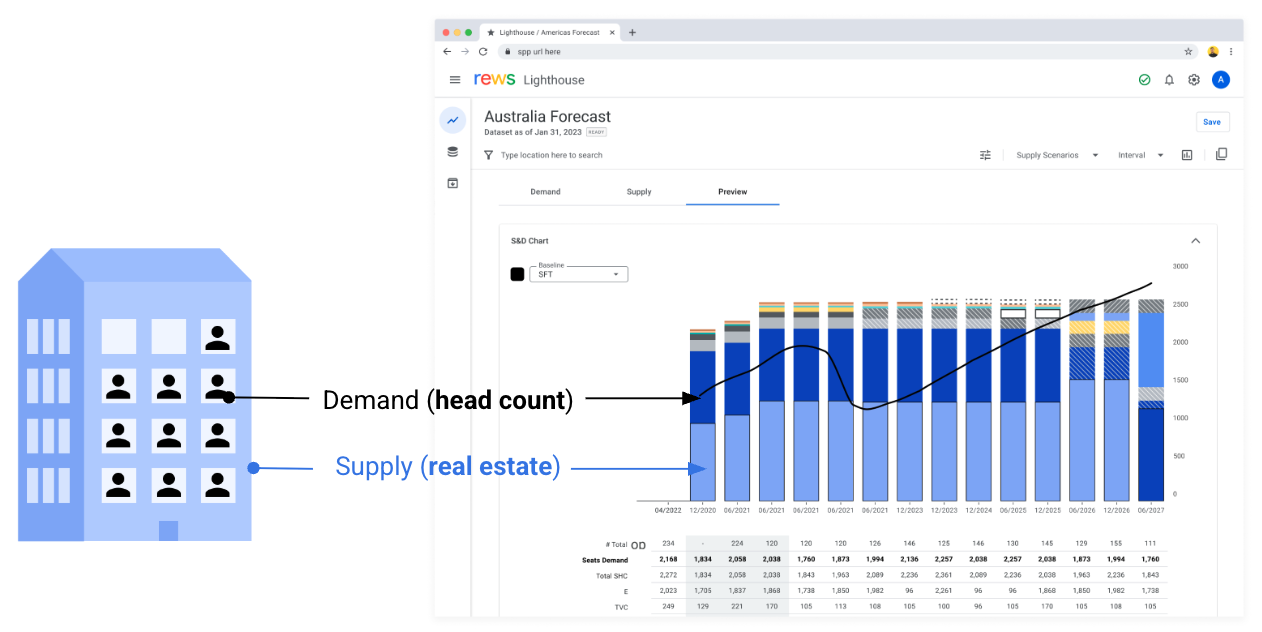
Lighthouse supports Google’s global real estate decisions. Planners can evaluate whether to lease, buy, extend, or exit properties by projecting demand (headcount growth) against supply (available seats) across locations and time. The system centralizes inputs, adds guardrails, and turns complex spreadsheets into decision-ready narratives.
“If the X team’s headcount (demand) grows X% annually for the next 10 years, we need to provide them X number of seats (supply).” — Lionel, Real Estate Planner
The Problem
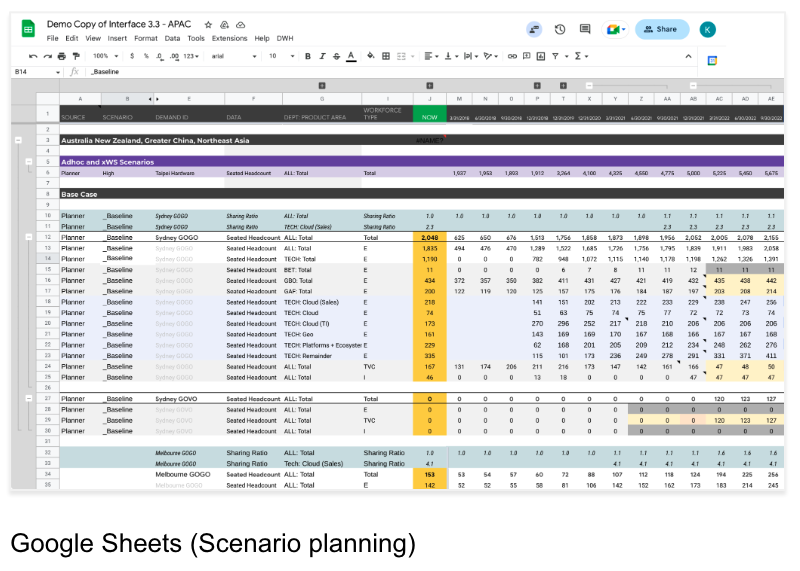
Global planning relied on disconnected Google Sheets. Data quality varied, schemas drifted, and cross-region scenarios were painful. Creating a 10-year view across teams and leases meant copy-pasting, error-prone formulas, and one-off decks for each review.
Goal
Enable planners to make better portfolio decisions so Google, product areas, and teams have the right space at the right time — by composing complex scenarios and answering questions faster.
Discovery
UX
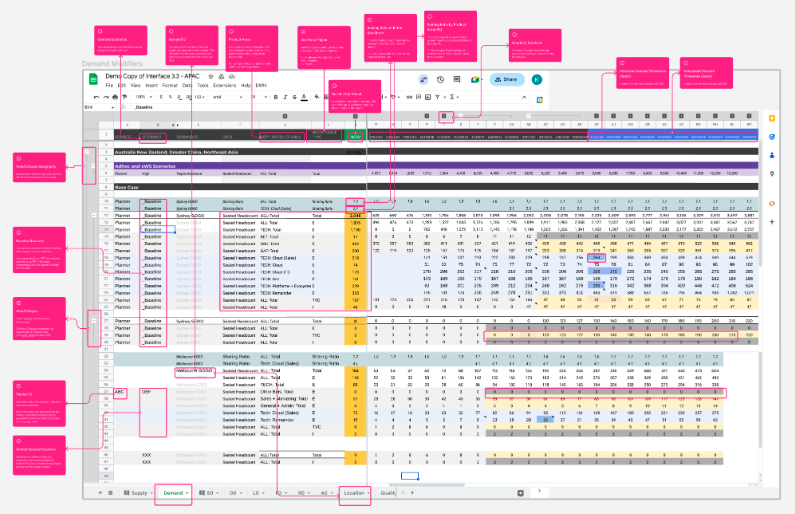
We deconstructed every tab, formula, and dependency used in current spreadsheets to inform the IA and guardrails Lighthouse needed.
Core Elements
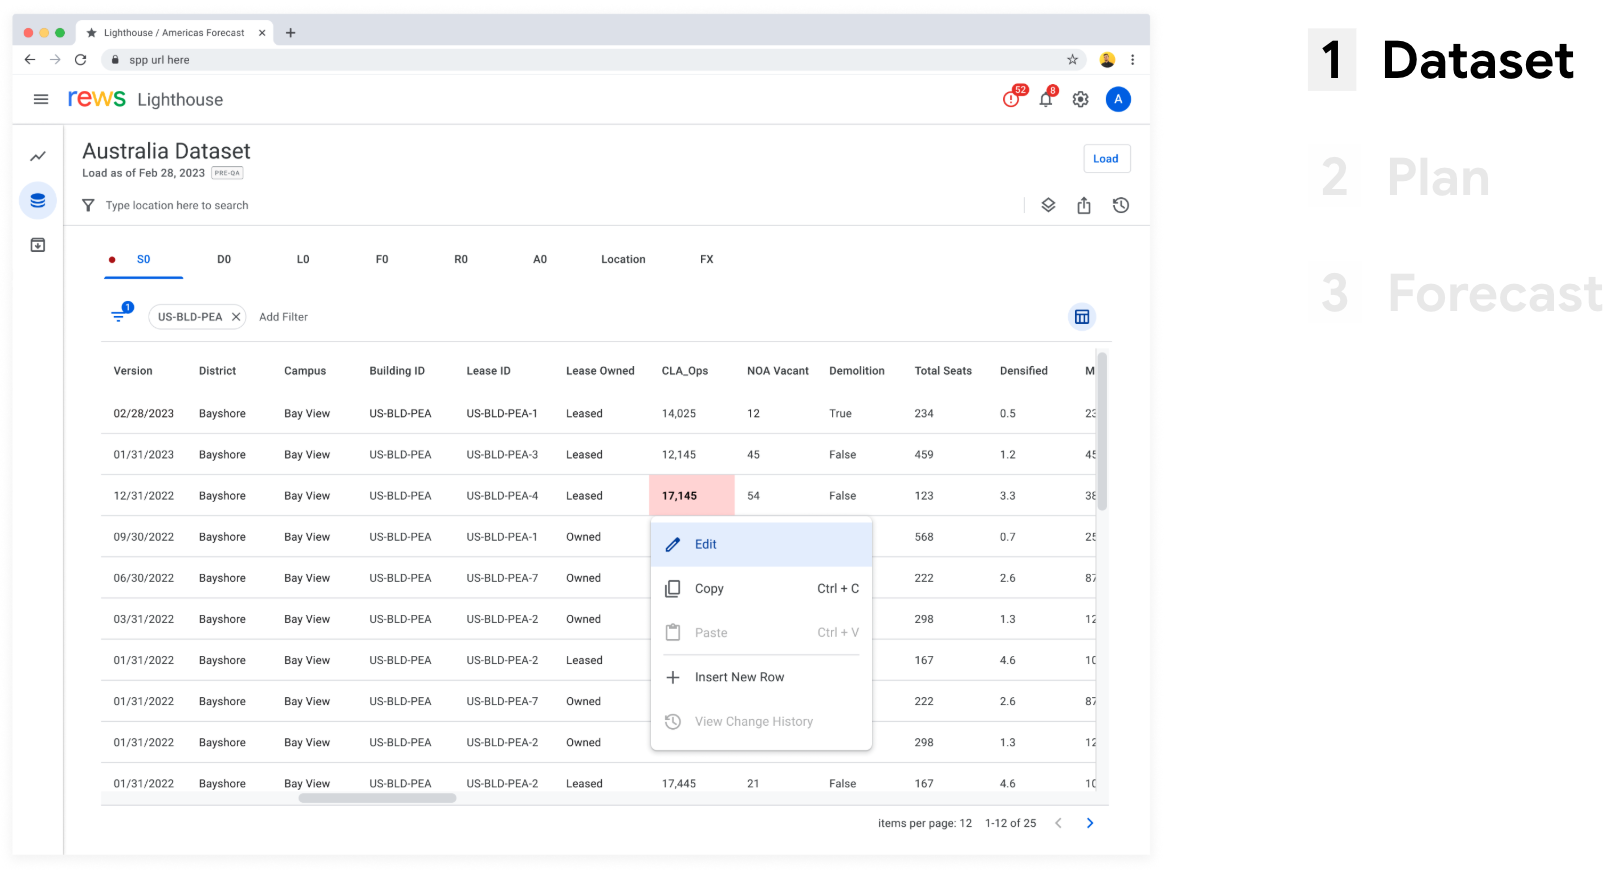
1) Dataset
Gather and validate source data across teams and regions. Lighthouse enforces schemas, codes, and freshness so planning starts from a trusted baseline.
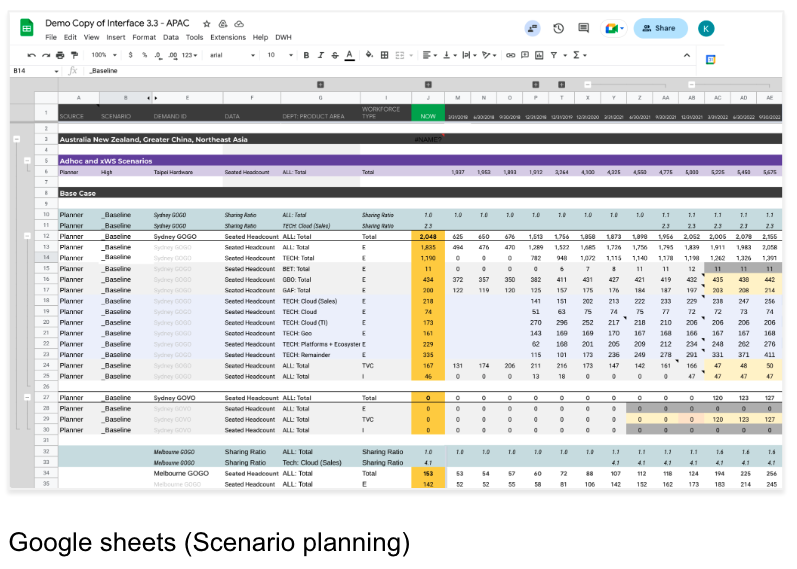
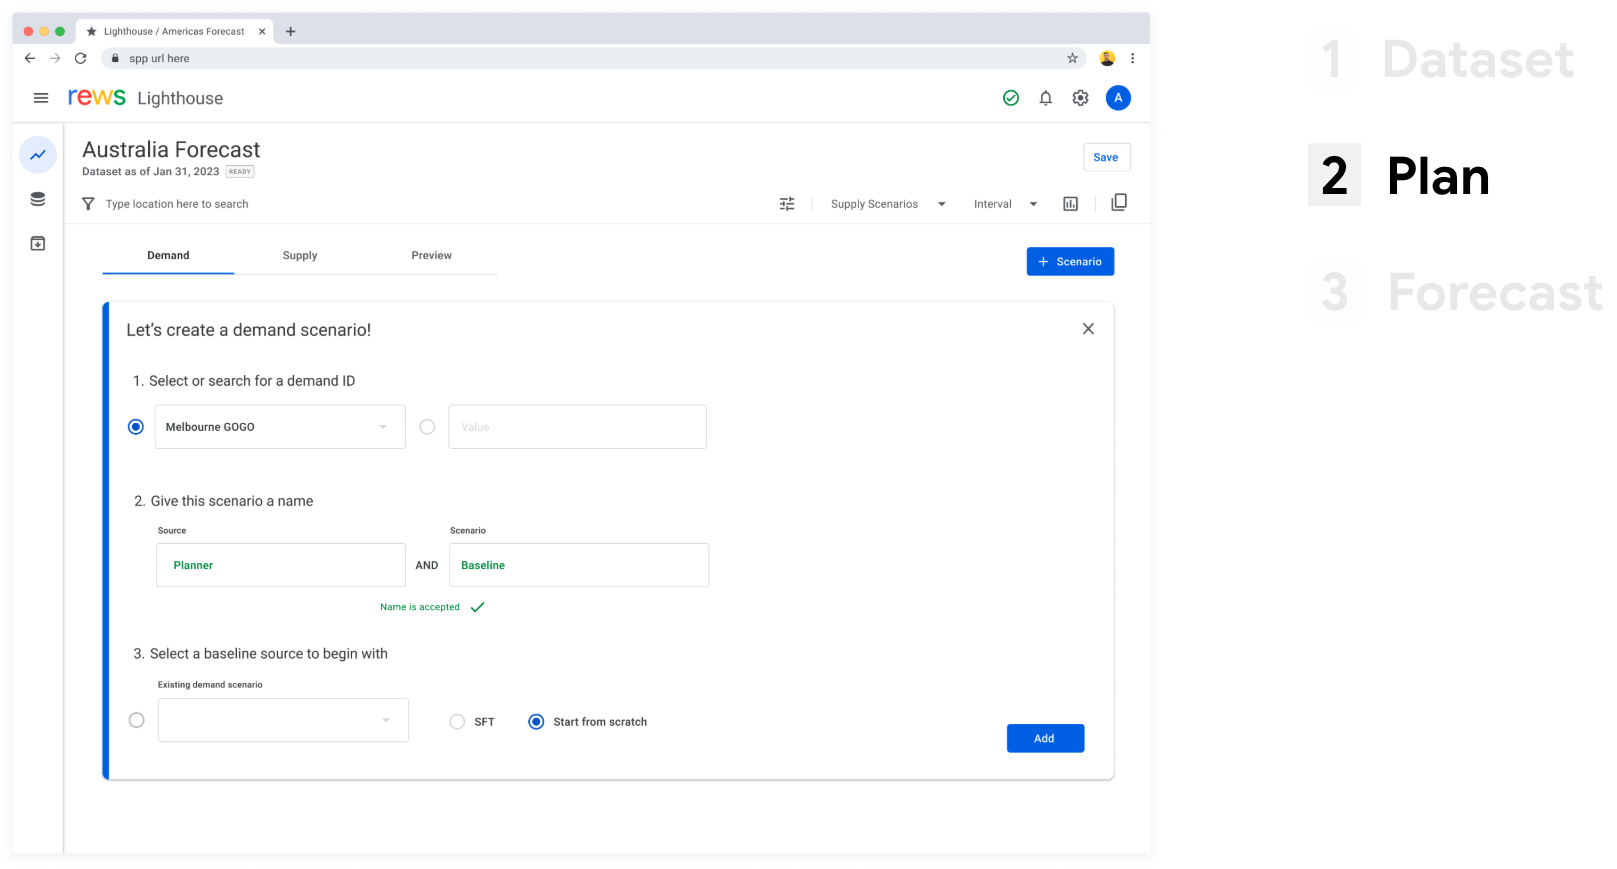
2) Plan
Model scenarios (optimistic, base, conservative) by adjusting growth, lease options, and relocations. Compare impacts by site, floor, and team.
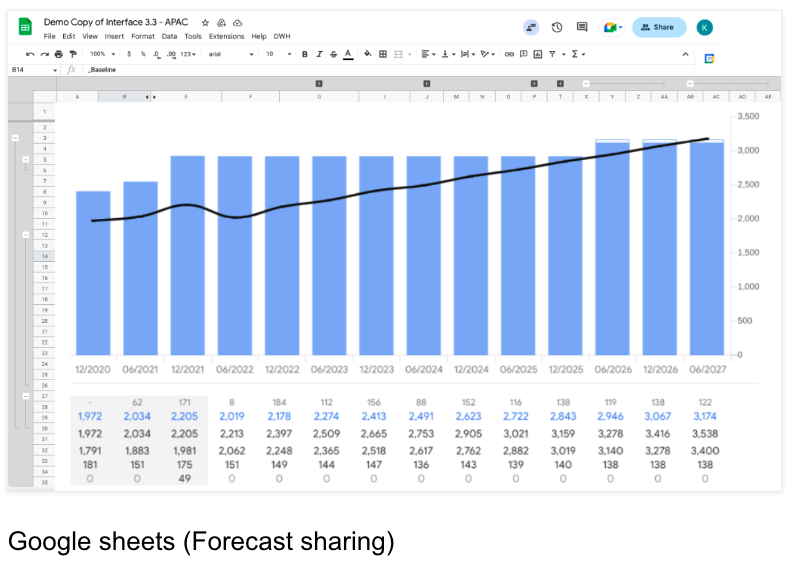
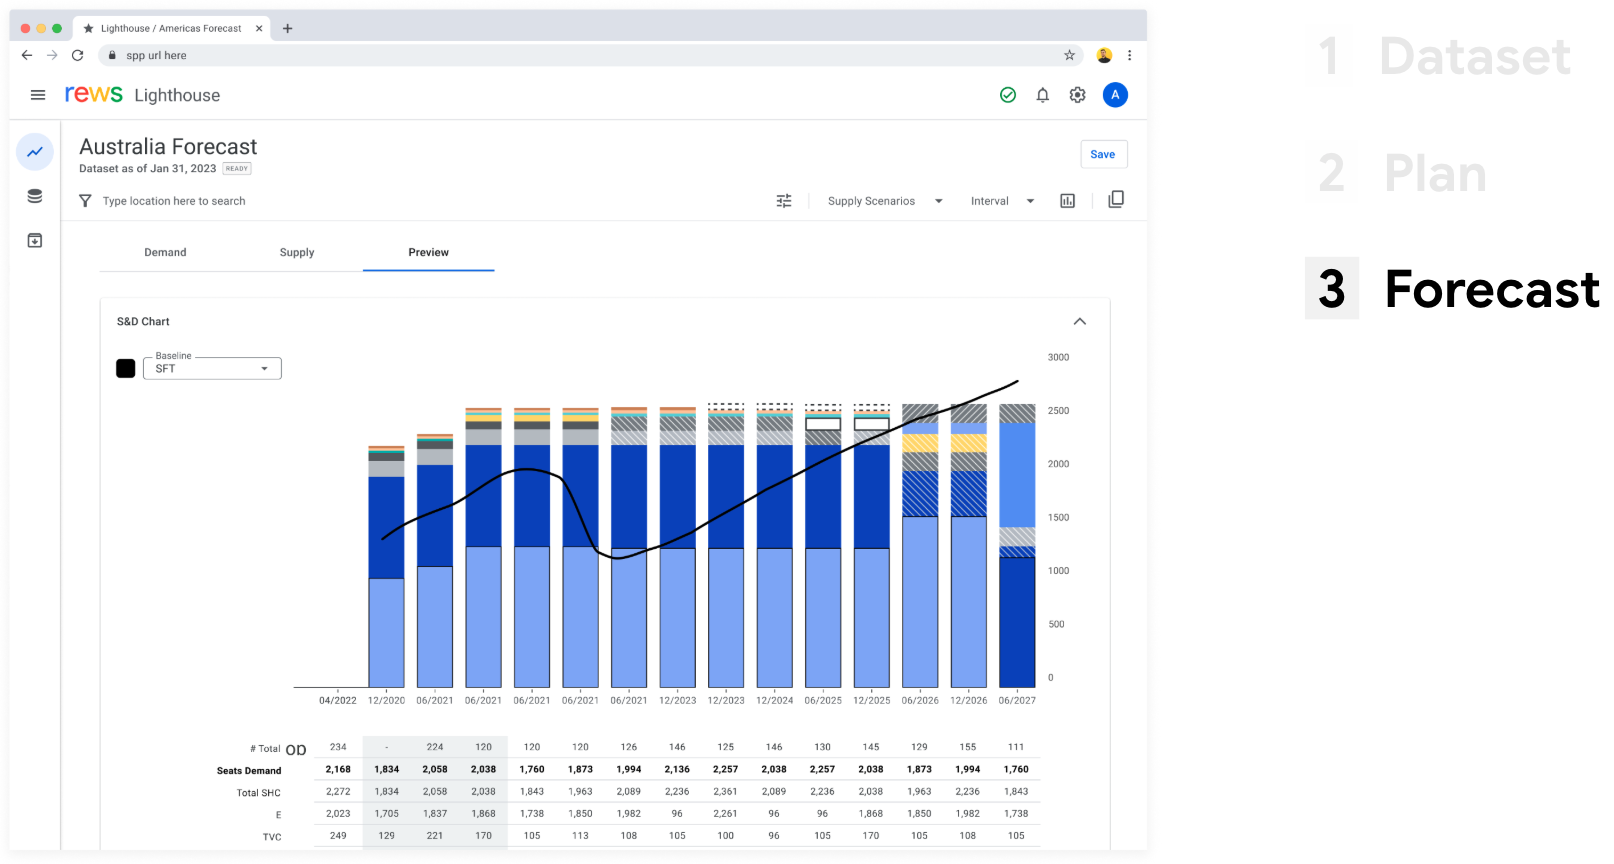
3) Forecast
Share scenario readouts with decision-makers — showing assumptions, risks, and trade-offs — so approvals happen faster and with fewer meetings.
Old Method — Limitations & Complications
- Validation: complicated checks, stale data, formula drift.
- Planning: Sheets couldn’t handle scenario complexity well.
- Presenting: manual slides; latency between data and decisions.
Research Insights
Google Drive is the backbone of the existing workflow — files, collaboration, sharing, and roles define how planners operate. Lighthouse embraces that reality instead of fighting it.
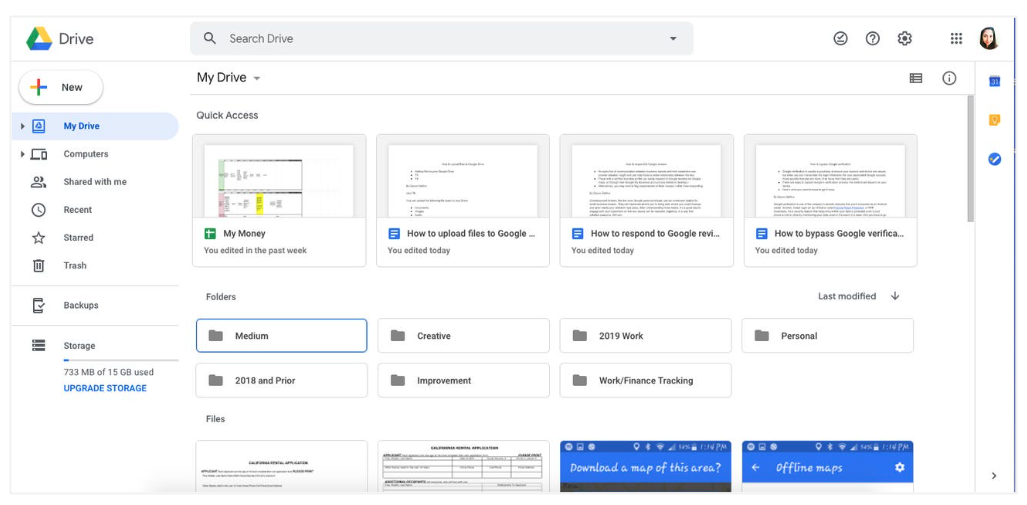
Files
Users create and share Sheets as they see fit. Lighthouse integrates with that file model.
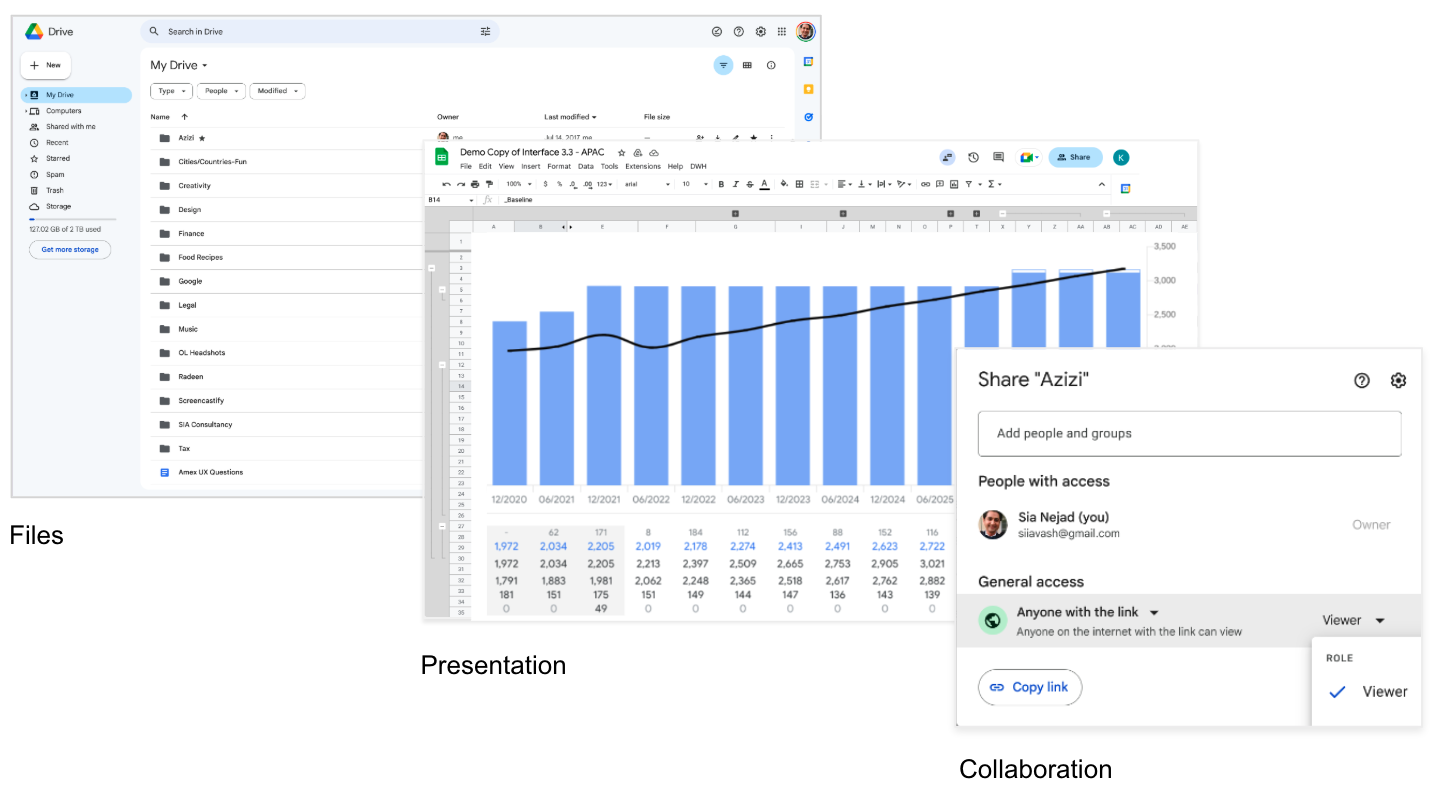
Roles
Owner, Editor, Viewer, Commenter — permissions map 1:1 to how planners already collaborate.
Permissions
What you can do depends on your role — e.g., edit cells, propose changes, or view-only for approvals.
Principles

Familiar
Leverage workflows users already know — Sheets, files, and sharing — to reduce onboarding time.

Intuitive
Expose only what’s needed for the task at hand. Make assumptions and risks explicit.

Agile
Ship the smallest useful layer, validate each planning cycle, and iterate without breaking teams.
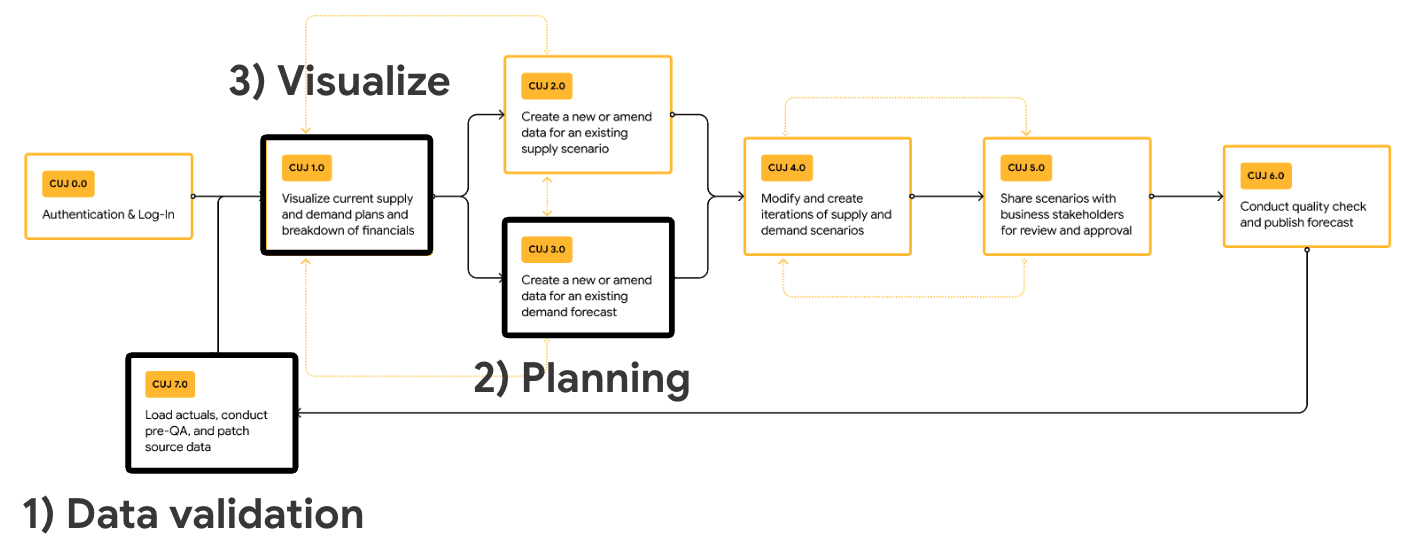
Sitemap & Critical User Journeys
We mapped the end-to-end flow from data intake to decision readouts, aligning roles and permissions at each step.
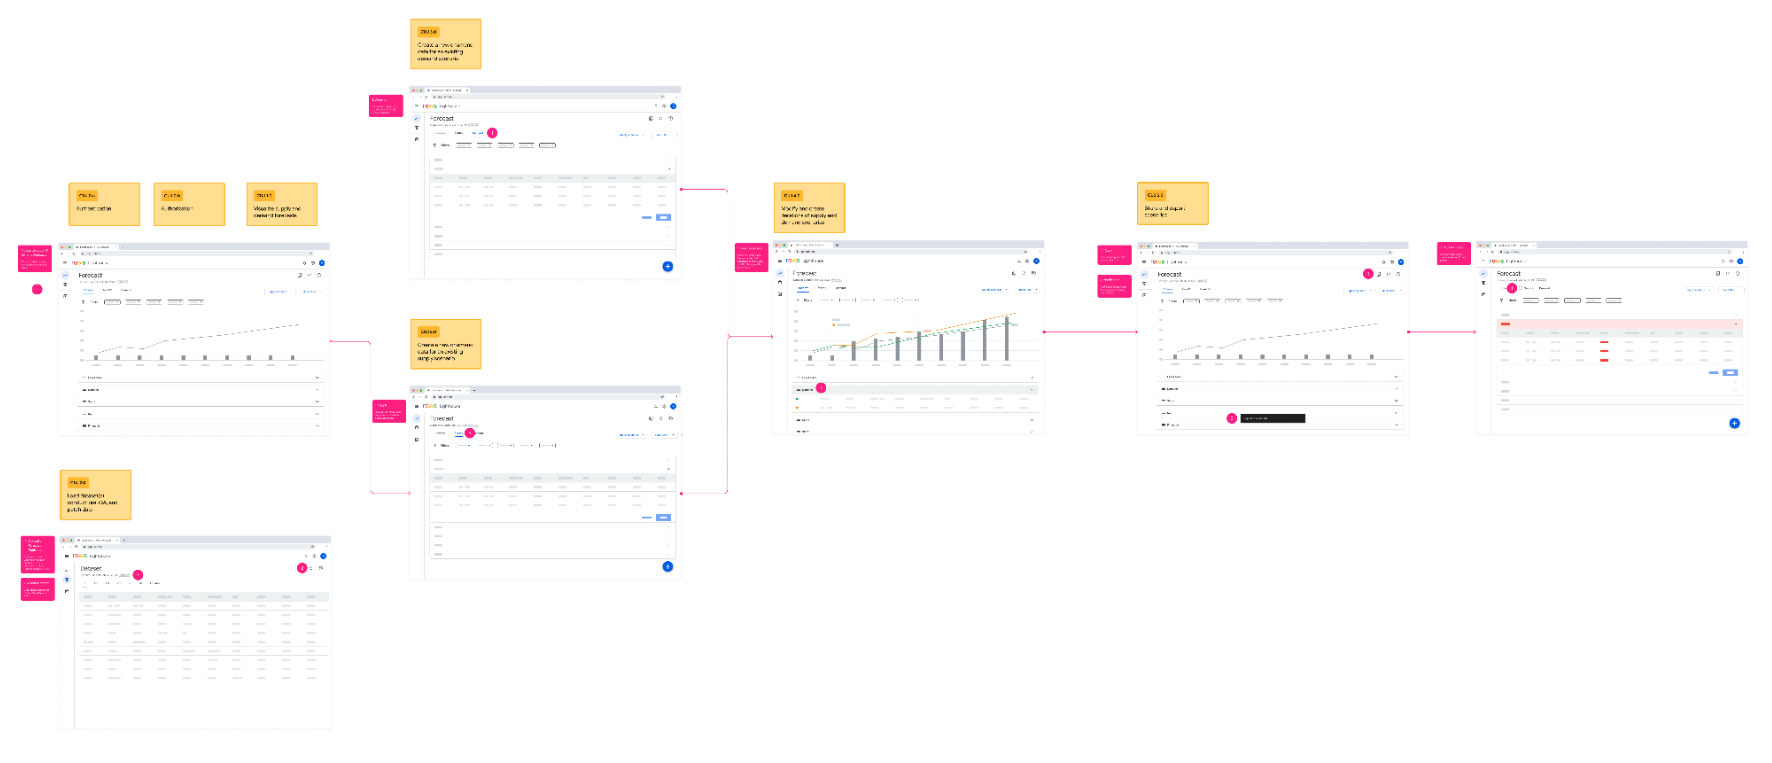
Wireframes
Low-fi wireframes explored the three-mode workflow (Dataset → Plan → Forecast), surfacing only the controls needed for each job.
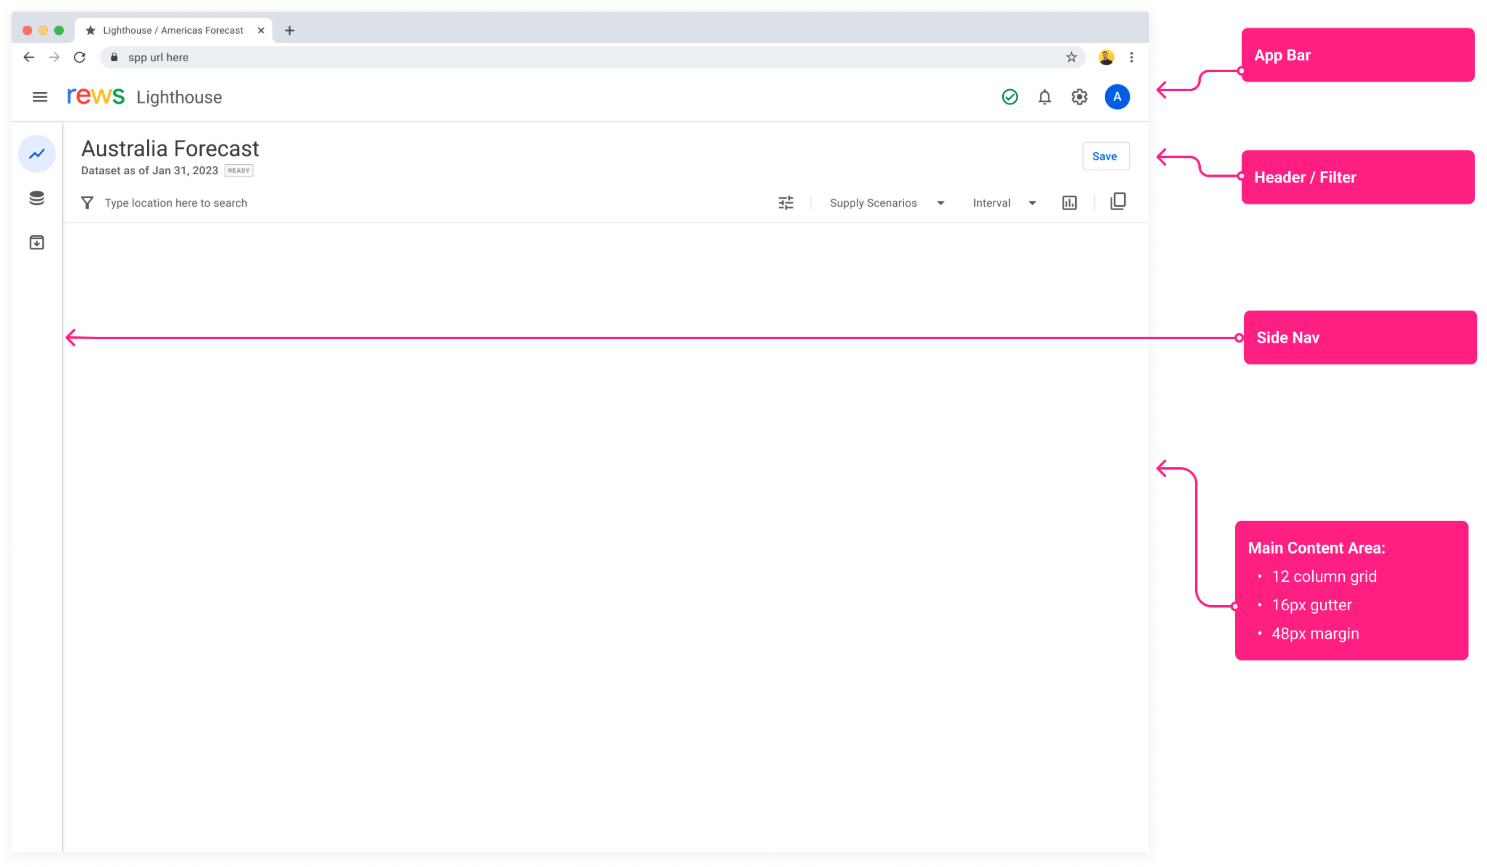
Final Design
App Skeleton
The skeleton organizes the experience into three clear modes with shared navigation and consistent patterns. Sheets remain the data layer; the UI adds validation, visualization, and permissions.
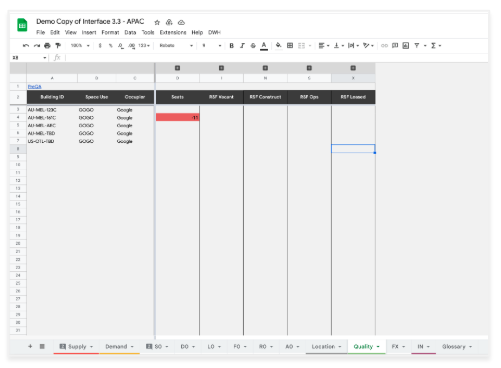
Data Validation
Schema checks, required fields, allowed codes, and staleness flags catch issues early. Owners resolve errors in-place, so planning doesn’t start on shaky ground.
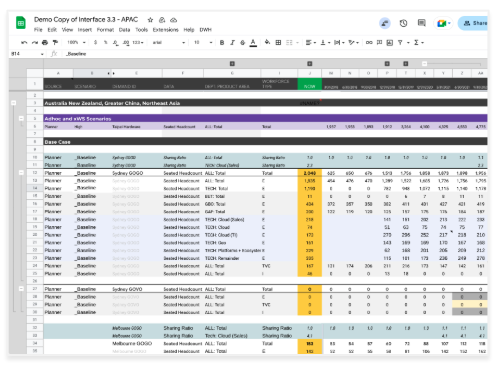
Planning
Adjust growth assumptions by team or location, test lease options, and visualize demand vs. supply month-over-month to spot gaps before they become fire drills.
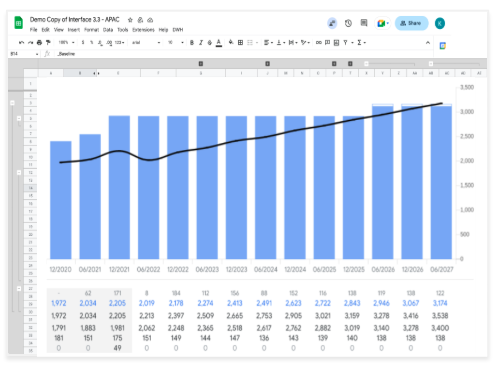
Forecast
Create decision-ready readouts that package assumptions, risks, trade-offs, and recommended actions — no more hand-built slides from scratch.
The Solution & Validation
Lighthouse hardens a familiar workflow instead of replacing it. By separating Dataset, Plan, and Forecast, we reduced cognitive load and created clear entry points for each role: data owners fix issues at the source; planners model scenarios with shared assumptions; executives review consistent, decision-ready narratives.
We piloted the MVP with 3 planning teams across different regions. Success criteria: reduce back-and-forth on data issues, shorten review prep, and ensure every decision readout stated assumptions, risks, and trade-offs explicitly. Feedback confirmed we hit the mark and guided the next iteration.
“I’m not spending half my review explaining where the numbers came from — the assumptions are right there.” — Ops lead
“The scenario sliders got us to a decision in one meeting instead of three.” — Real estate planner
“Keeping Sheets as the source saved months of change-management.” — PM partner