
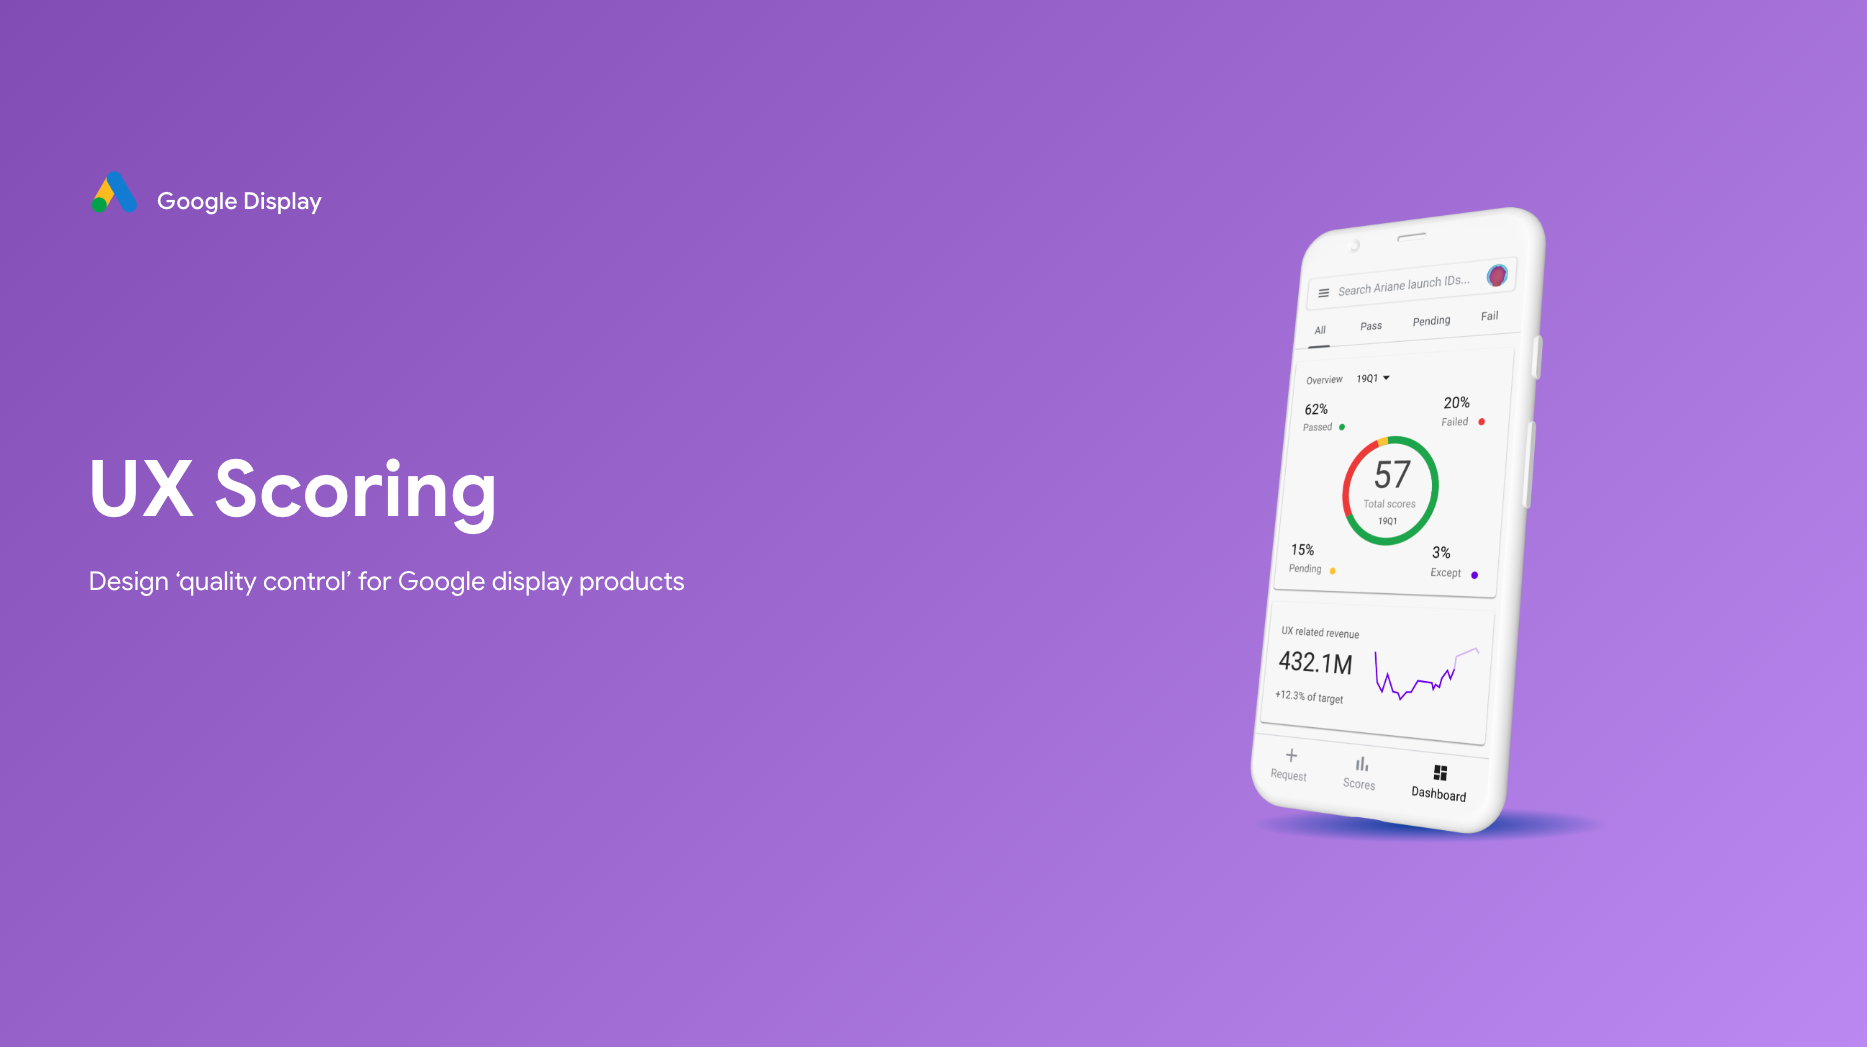
UX Scoring
I led a self-initiated effort at Google to build a design quality system—process + tools—that turned subjective debates into objective, evidence-based launch decisions.
Problem: Launches stalled in subjective debates; UX quality was inconsistent; approvals were unpredictable.
Approach: Standardized guidelines, an objective scorecard, and auto-linked feedback reports—designed with cross-functional input.
Outcome: Predictable approvals, less friction, and higher product quality. Specific adoption/impact details available in interviews.
My Role
Self-Initiated Project
- Identified the quality gap and proposed a system to leadership.
- Presented to senior leaders and secured sponsorship to proceed.
Design & Planning
- Aligned on goals, deliverables, and timeline with leadership.
- Co-designed with cross-functional partners to shape the final system.
Team Leadership
- Planned and facilitated a focused design sprint.
- Led weekly rituals across PM, Eng, UXR, and Design.

Sprint to align on approach and de-risk adoption.
Product Overview
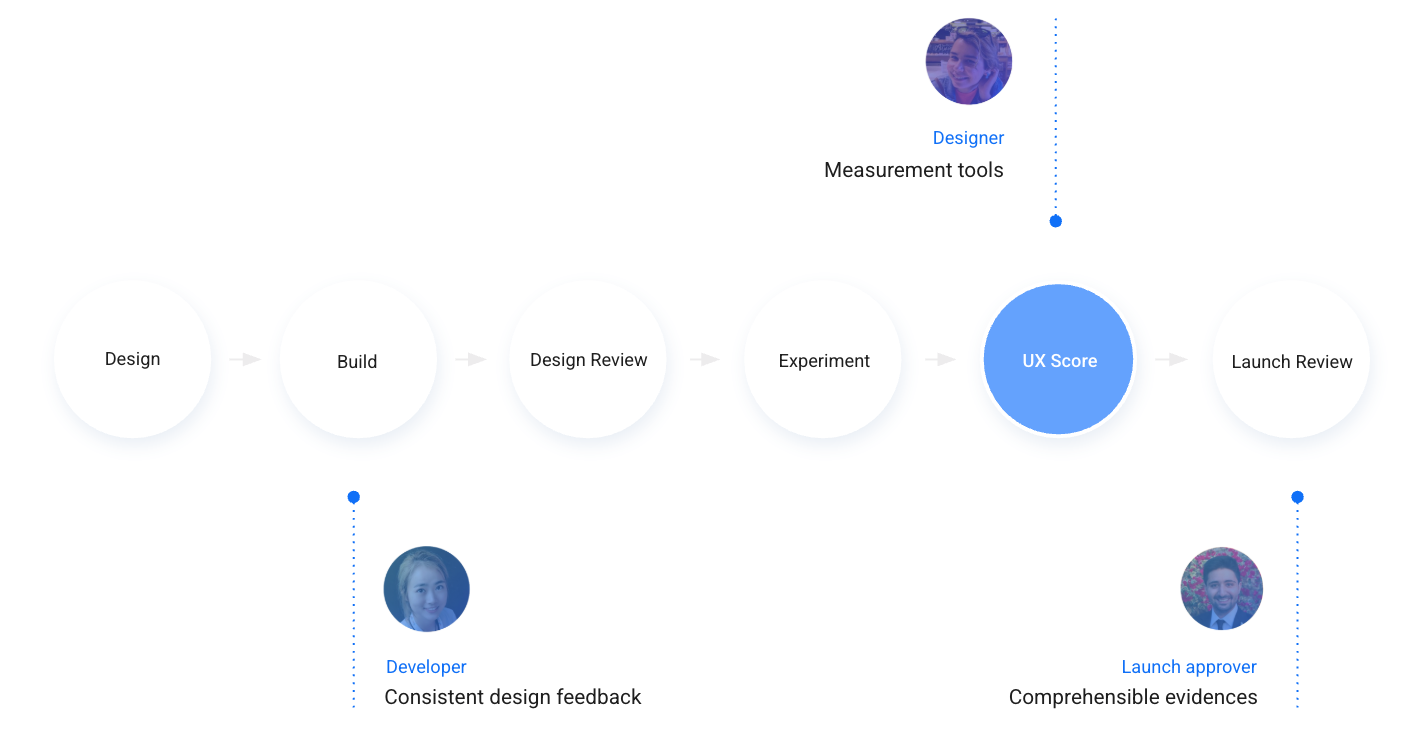
UX Scoring is a governance system that evaluates design quality before launch. It creates a shared, objective language for “product excellence” and streamlines go/no-go decisions.
Process + tools: guidelines → scorecard → feedback report.
The Challenge
Products were launching with inconsistent UX and avoidable issues. There were no shared guidelines or metrics, creating friction between teams, last-minute escalations, and costly delays.
I proposed a system to replace subjective debates with objective evidence. With leadership support, I formed a cross-functional group to design and pilot the approach.
Without shared criteria, “quality” becomes opinion and slows launches.
Diagnosing the Pain Points
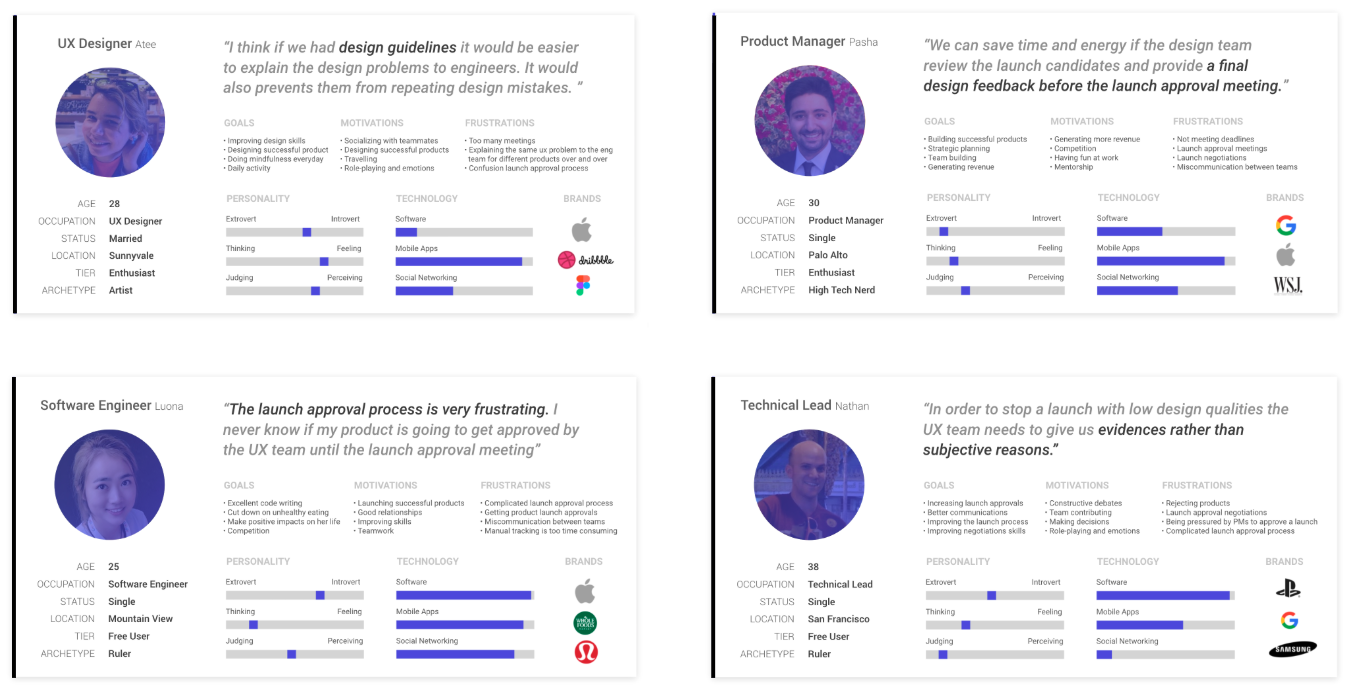
I led interviews across UX, PM, and Engineering. The recurring theme: teams needed evidence, not opinions, and earlier signals—not surprises at launch review.
Personas
Pain Points
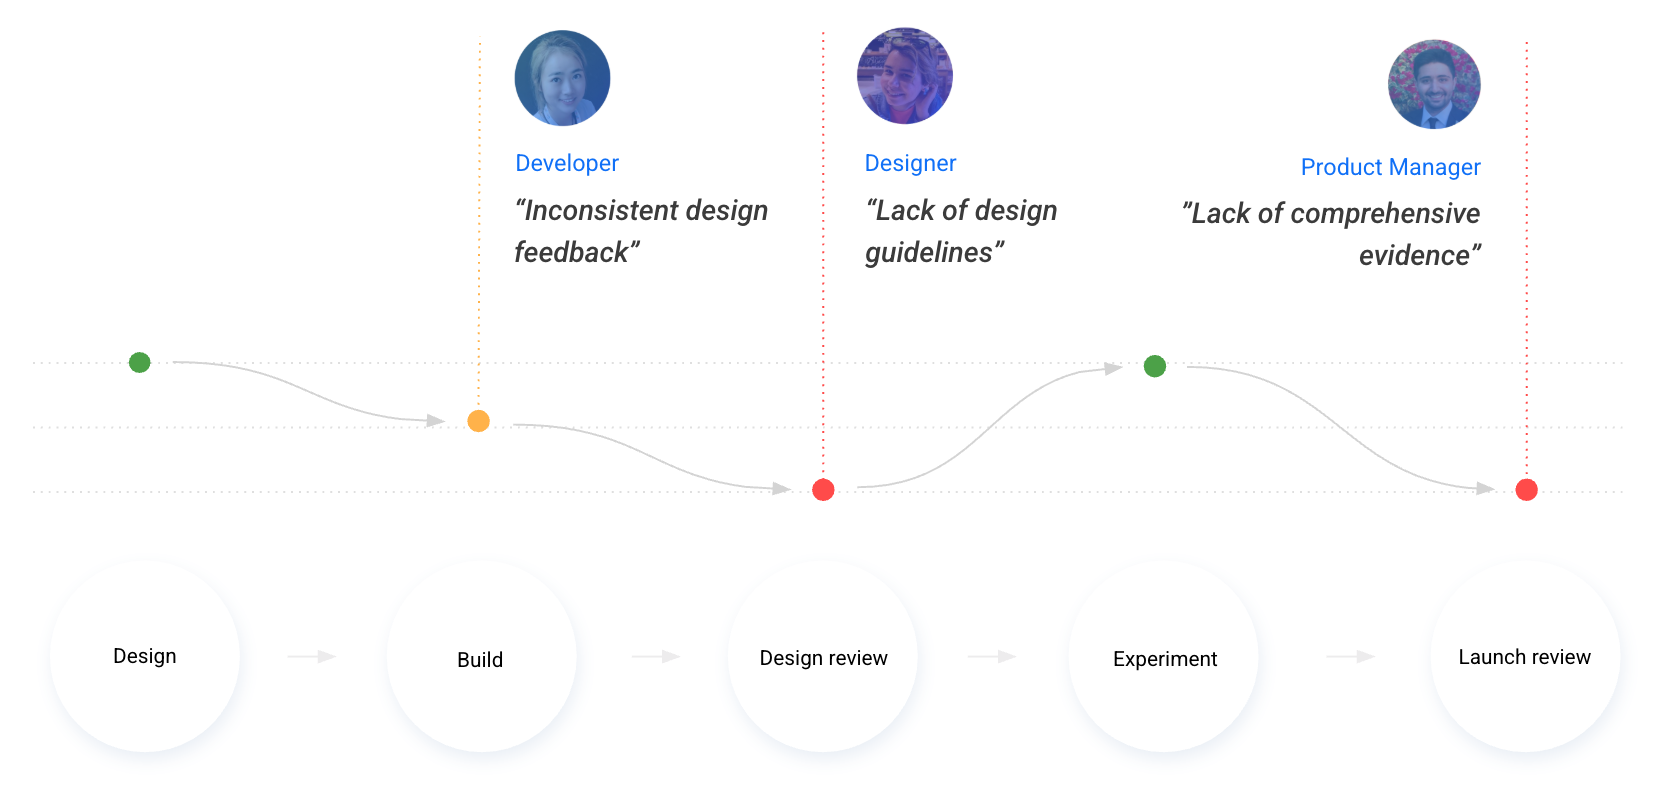
“To stop a launch over low design quality, we need evidence, not opinions.” — Technical Lead
“Launch approvals are frustrating—I don’t know where we stand until the meeting.” — Software Engineer
“If design reviews happened earlier, we’d save time and energy.” — Product Manager
Defining Our Direction
With leadership, I framed a clear vision and operating principles to guide the build and adoption.
Vision
All products meet product-excellence standards prior to launch.
Mission
Equip teams with tools and guidelines to measure UX quality objectively.
Goals
Define consistent attributes and patterns to avoid repeat issues.
Provide a scorecard to evaluate UX and surface targeted feedback.
Attach scores and guideline links to justify decisions.
Guiding Principles
Reduce—not add—friction between teams.
Scores and launch data are transparent by default.
Works across product areas and team sizes.
Designing an Ecosystem for Quality
Research made it clear: one tool wouldn’t fix a process problem. I led the design of a system that teams could actually run end-to-end.
1) Standardized Guidelines
A centralized, practical set of visual and usability standards gave teams a shared language—and prevented repeat issues.
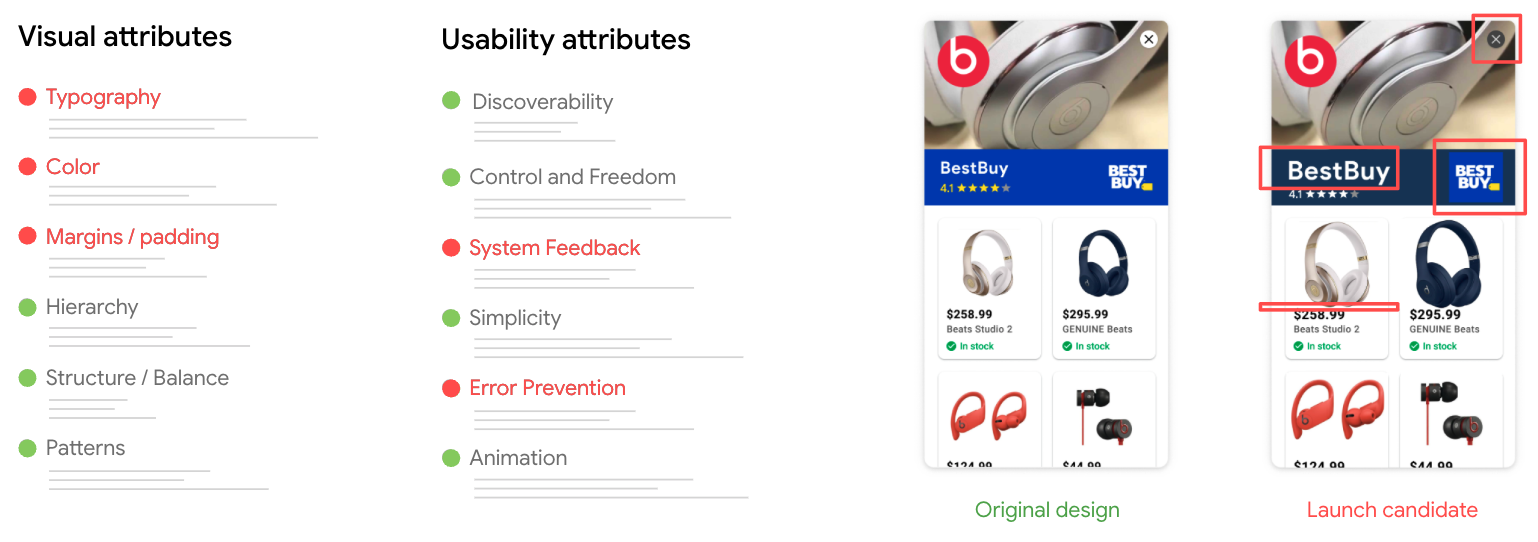
A single source of truth for UX quality expectations.
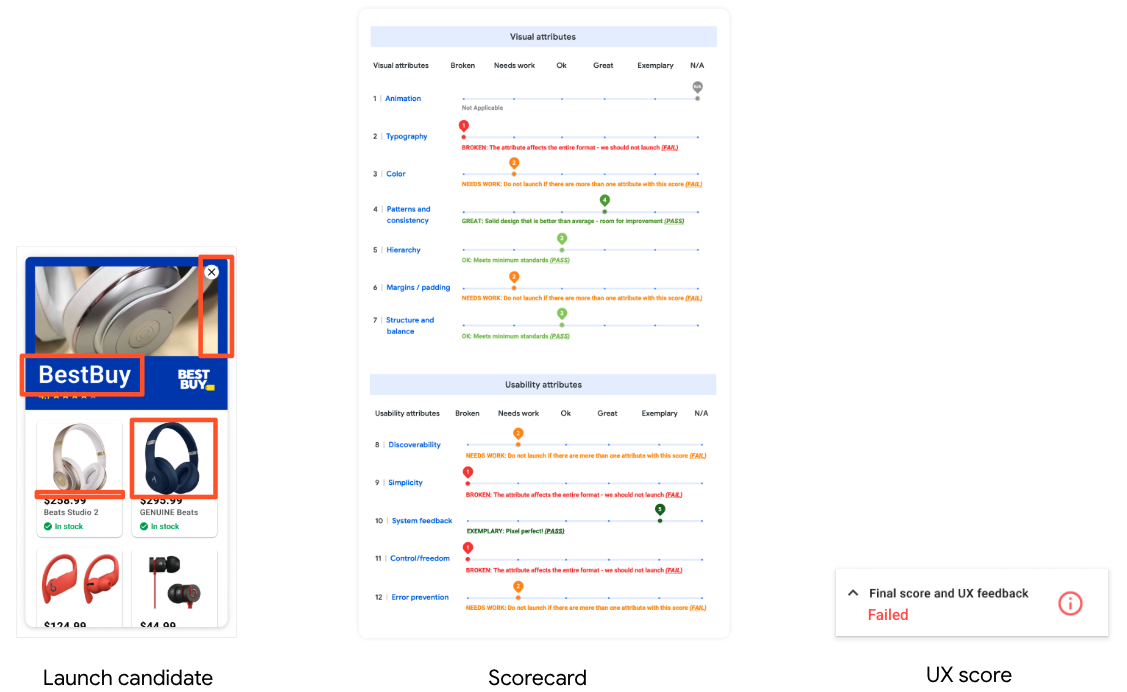
2) Data-Driven Scorecard
Designers evaluate a product against the guidelines to produce a score. This shifted reviews from opinion to evidence.
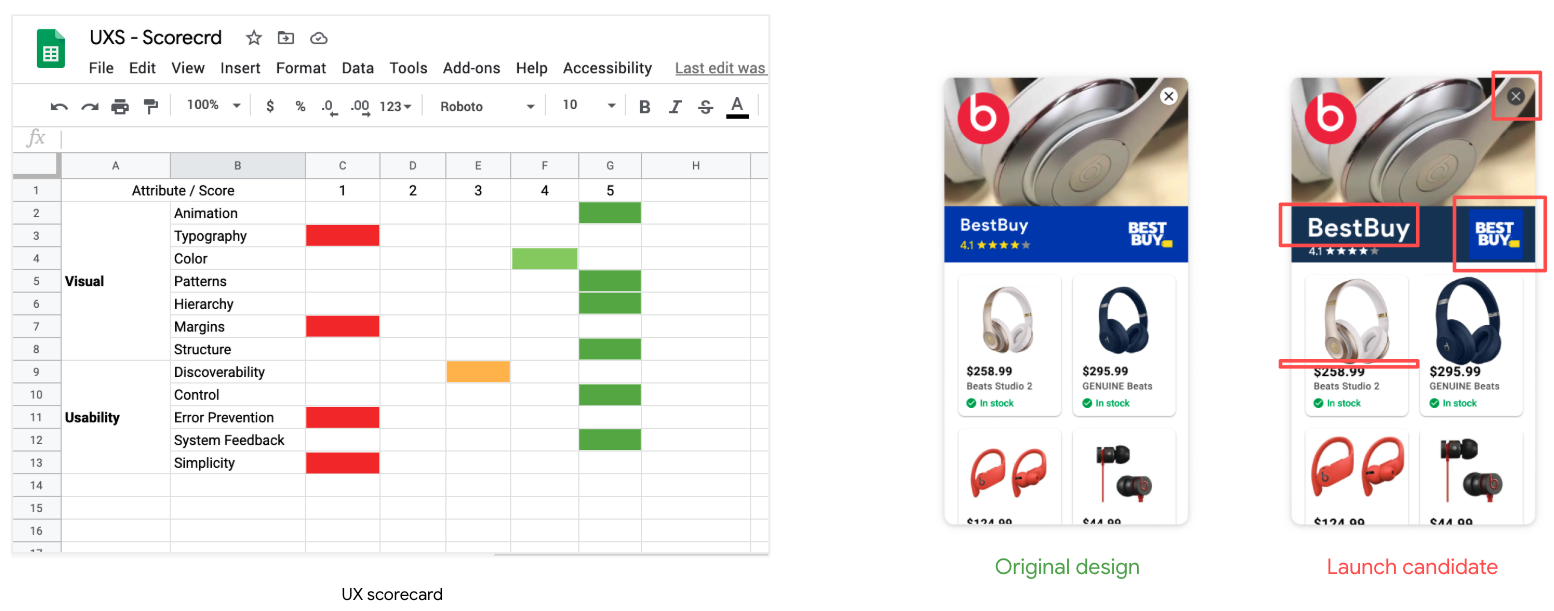
Scorecard turns subjective feedback into objective criteria.
3) Linked Feedback Reports
Automated reports attach evidence with links to the exact guidelines and give clear, prioritized next steps.
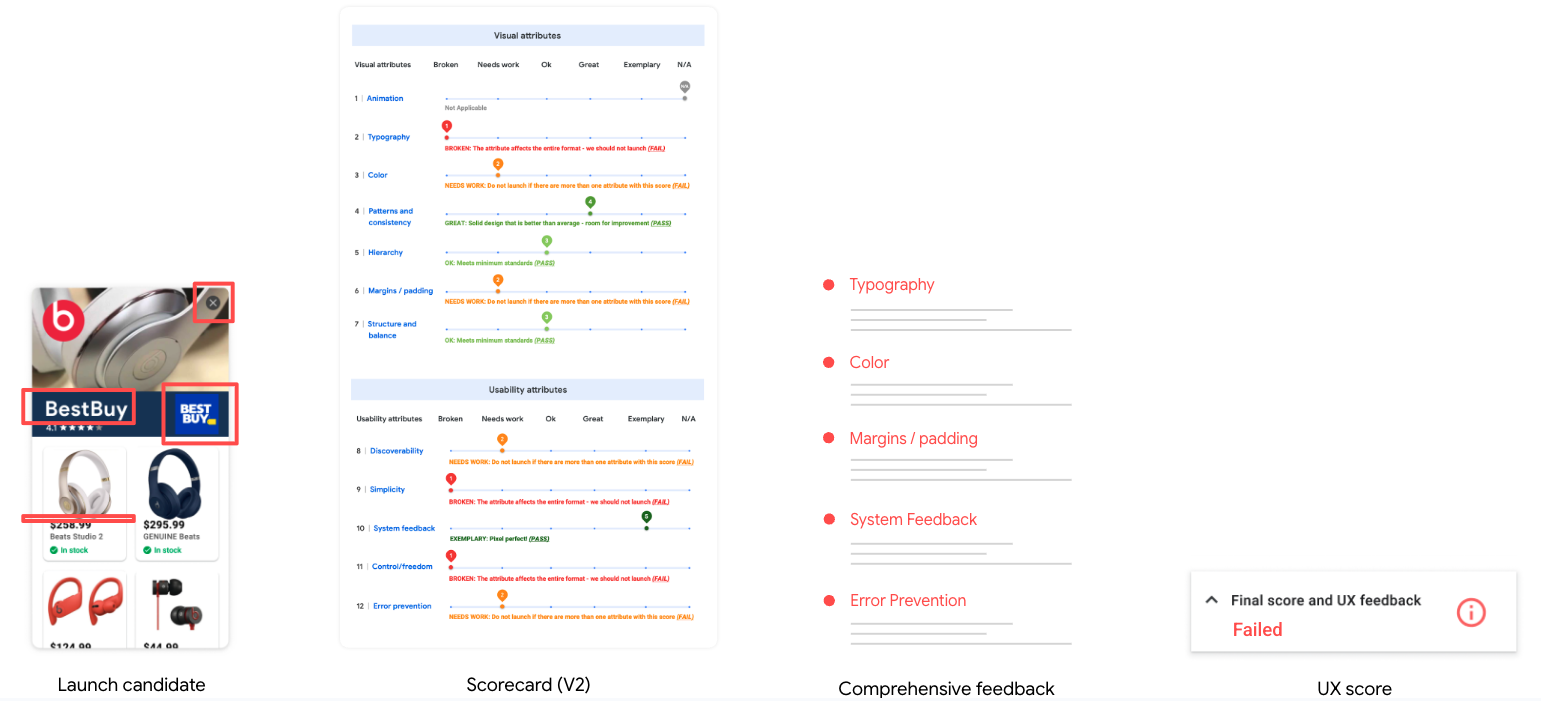
Actionable guidance that teams can ship against.
Product Design & Evolution
From early wireframes to high-fidelity, we iterated through a sprint and weekly critique to remove friction from every step.
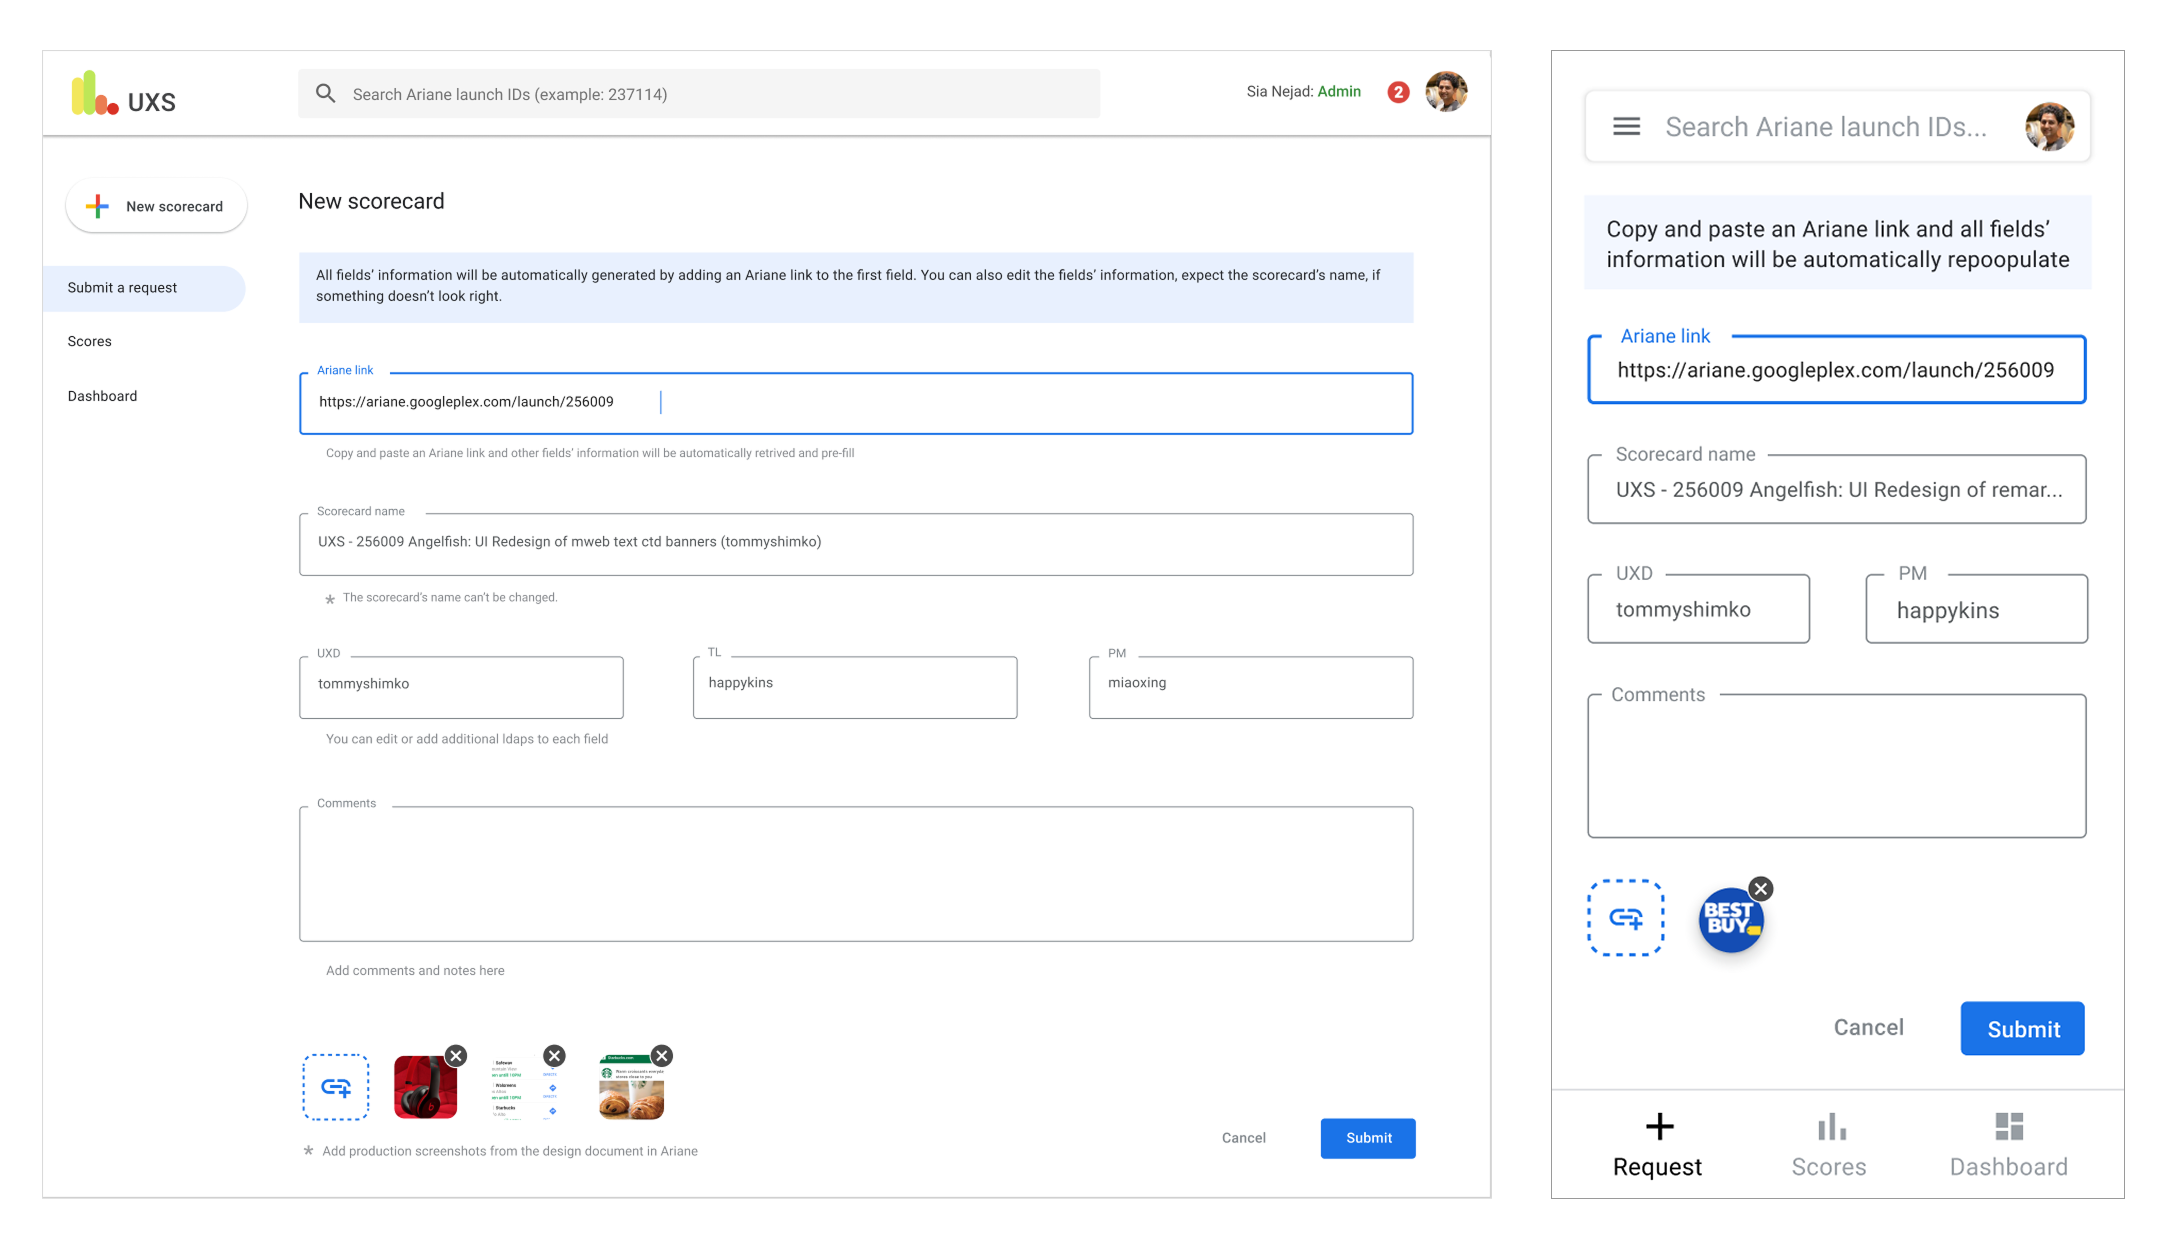
UX Score Request Form
A lightweight intake that captures scope, stage, and owner quickly—auto-routing requests to the right reviewer and setting clear expectations.
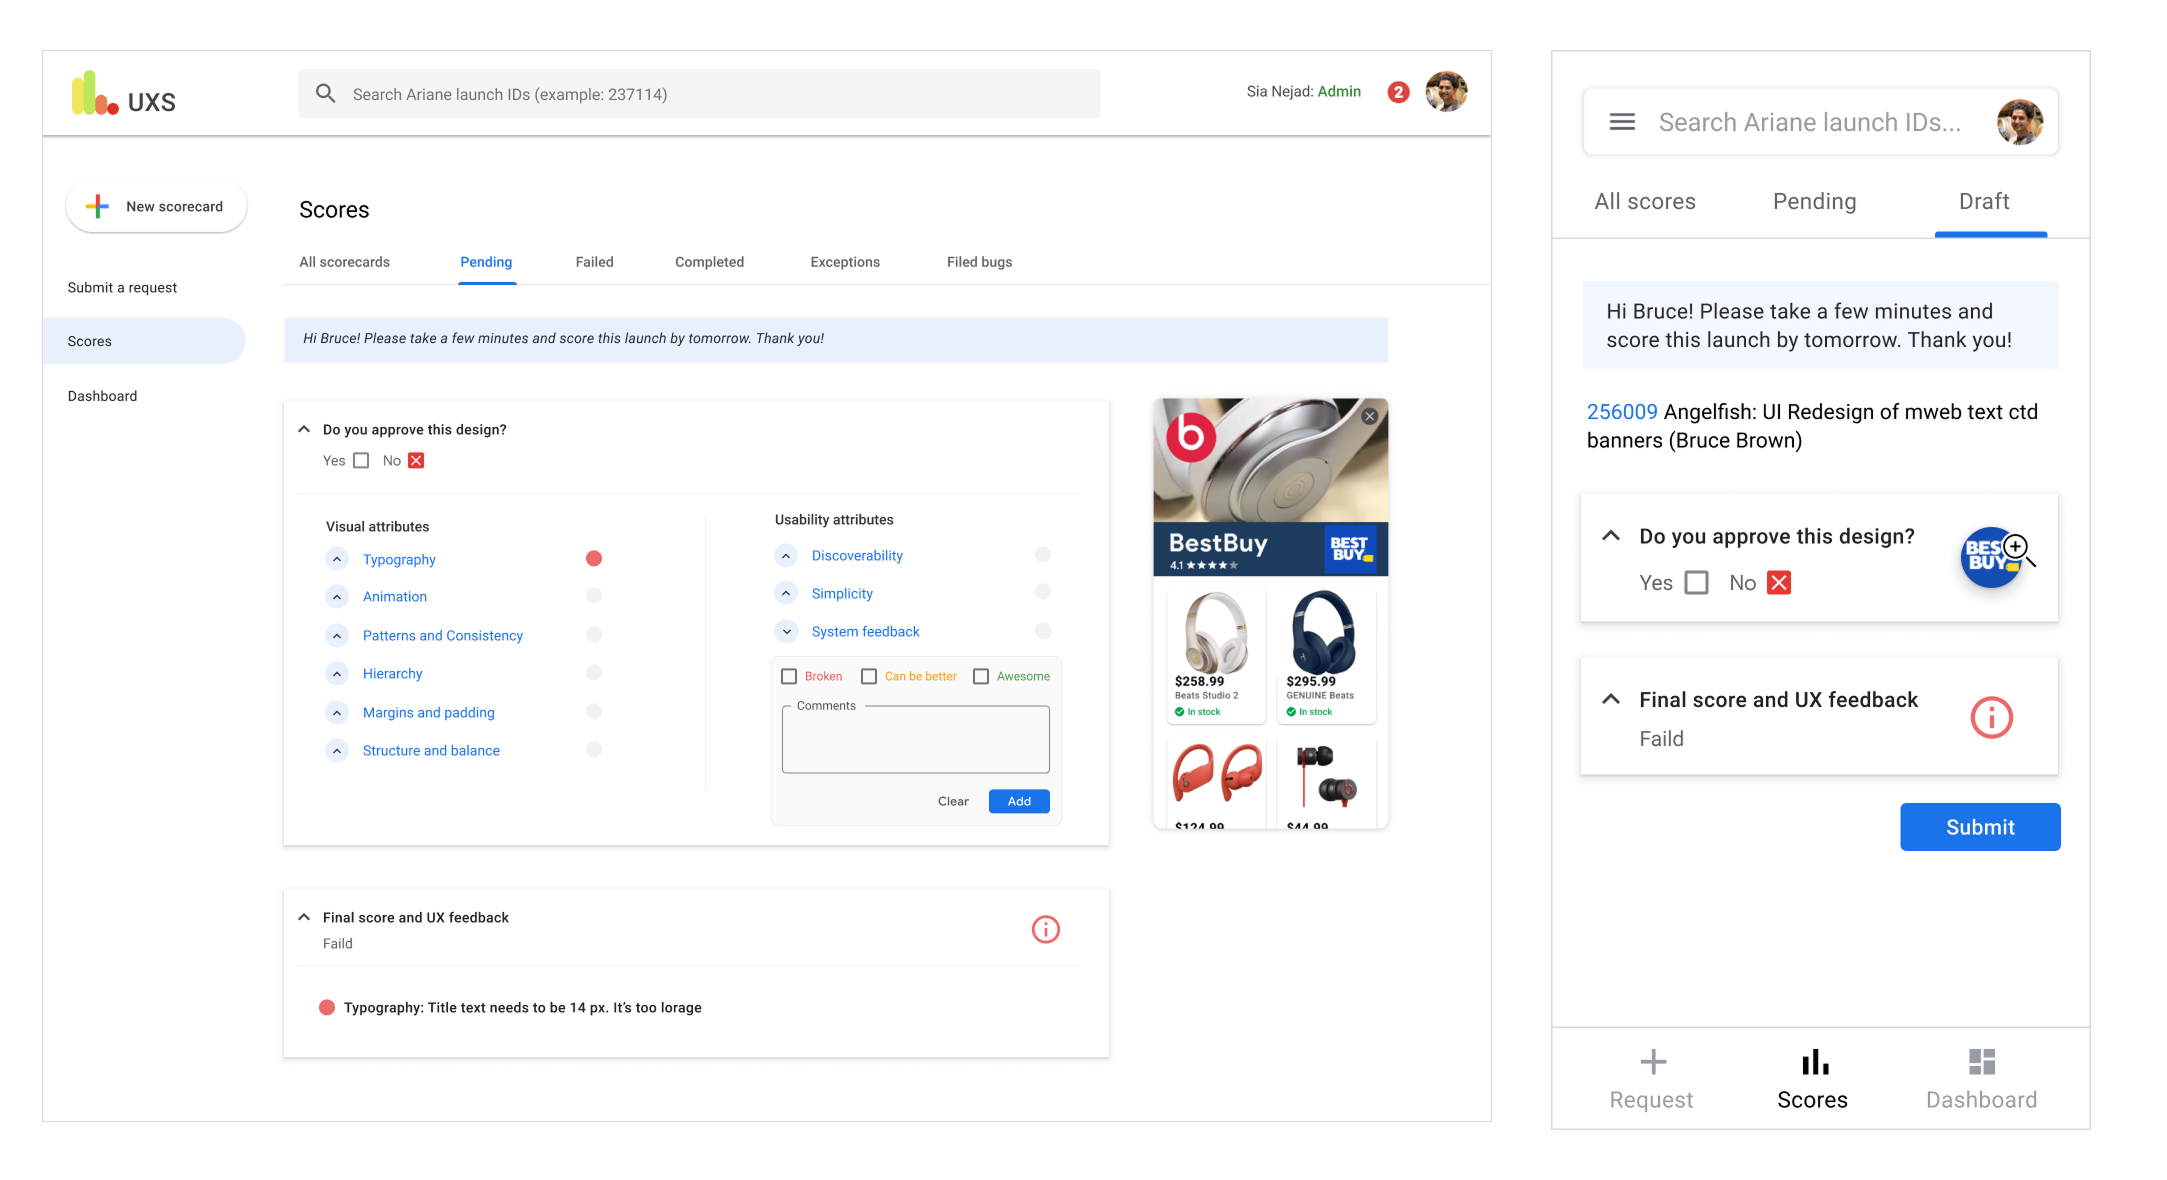
Scorecard
Evaluator view maps each criterion to a guideline, applies weights, and flags blockers with rationale and examples—turning debate into a defendable score.
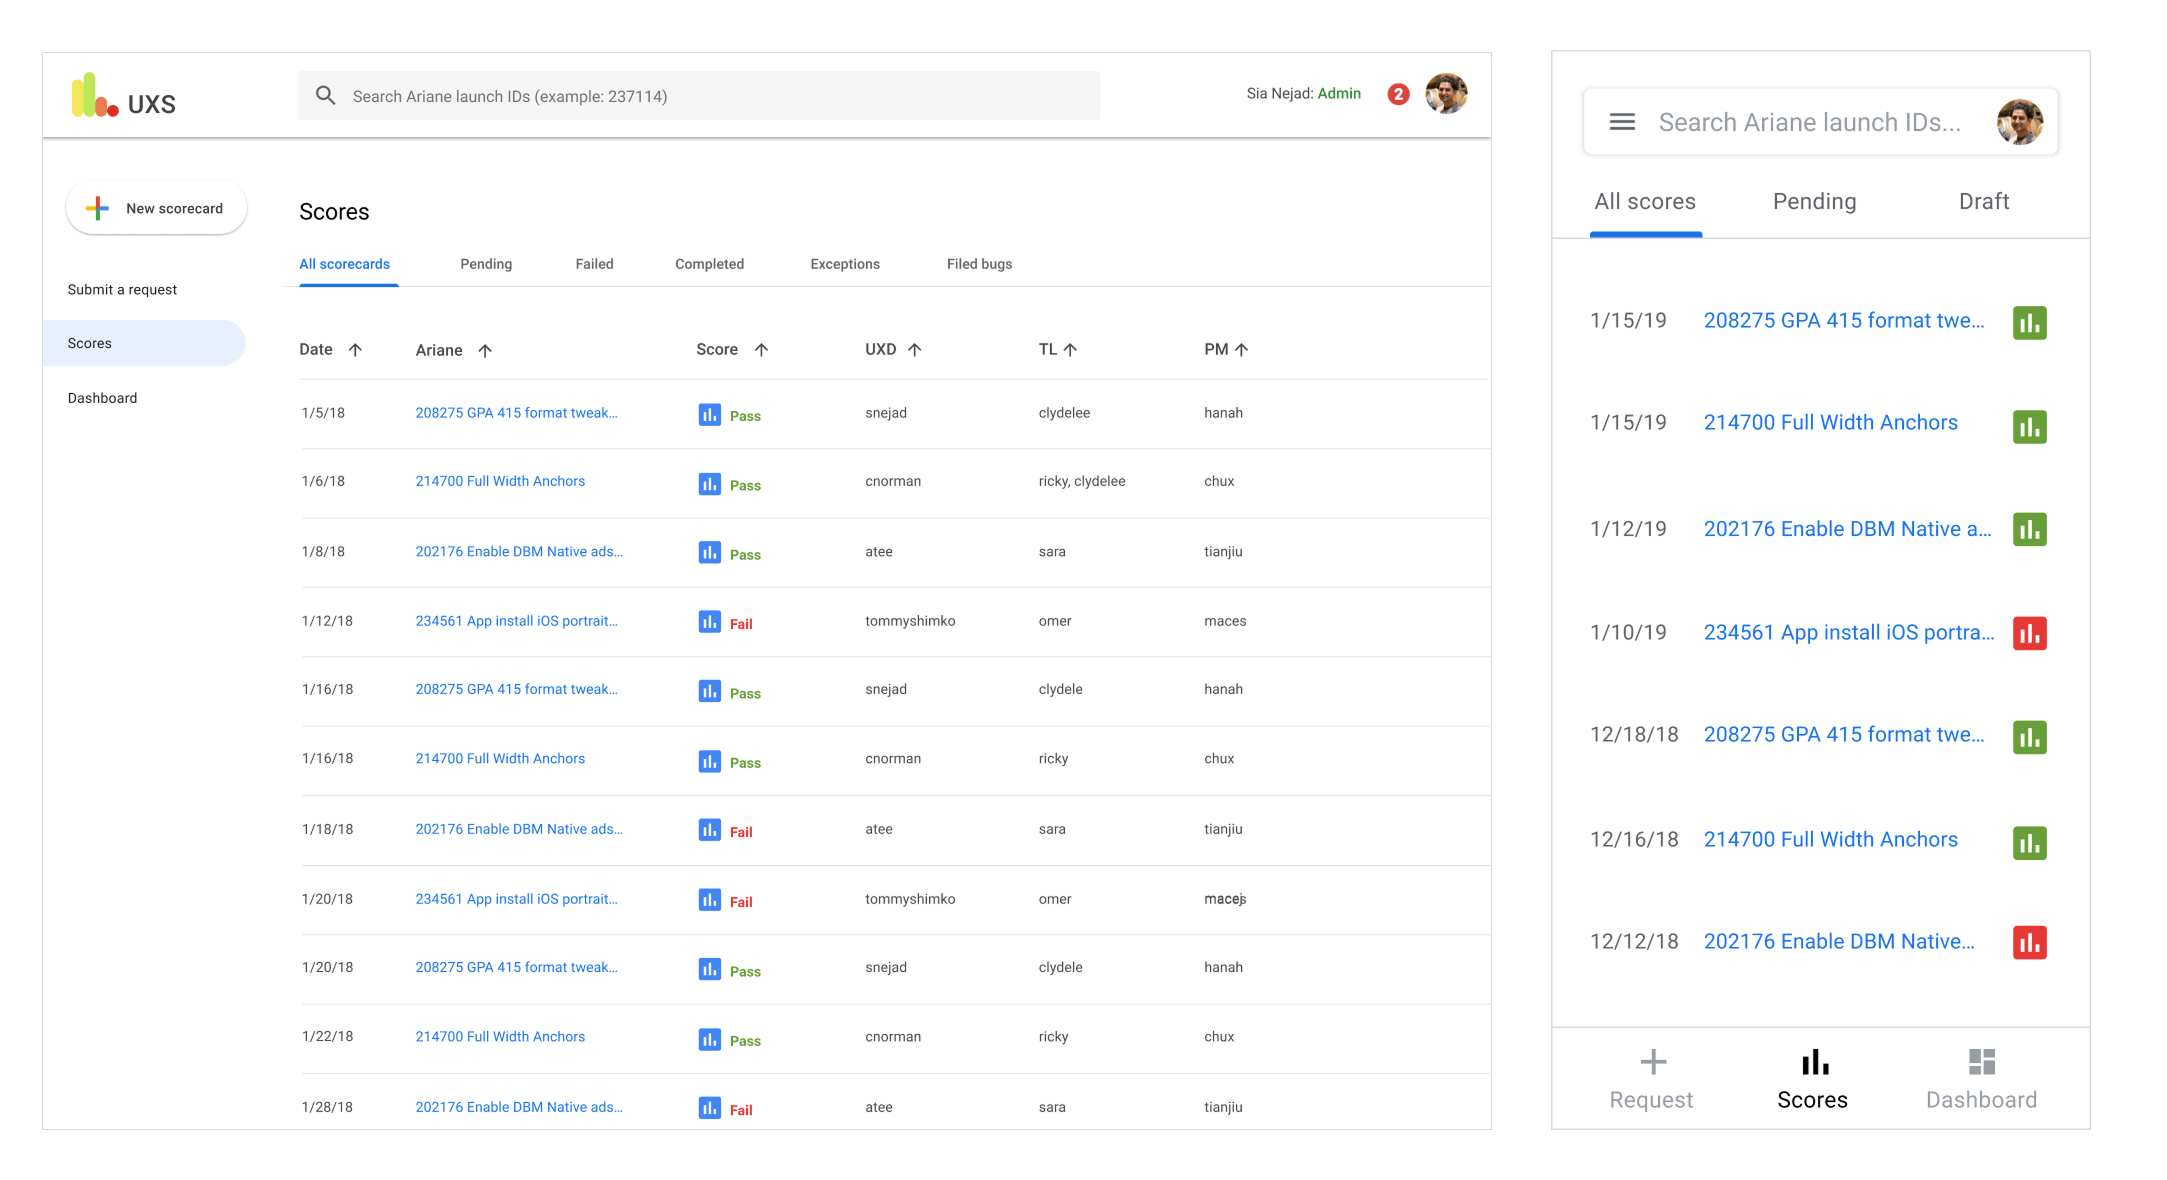
UX Scores Repository
Central, searchable history of reviews by product and release—helping teams compare trends over time and reuse prior feedback.
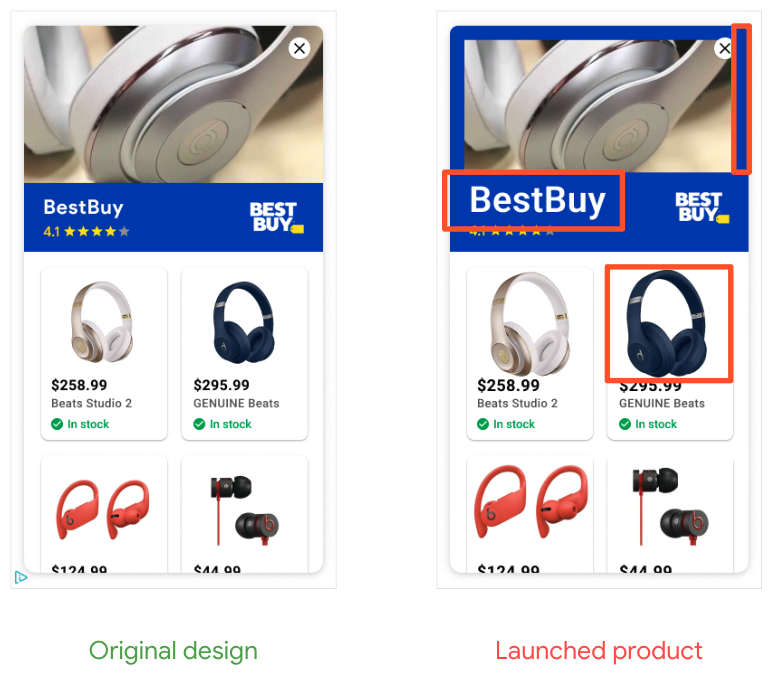
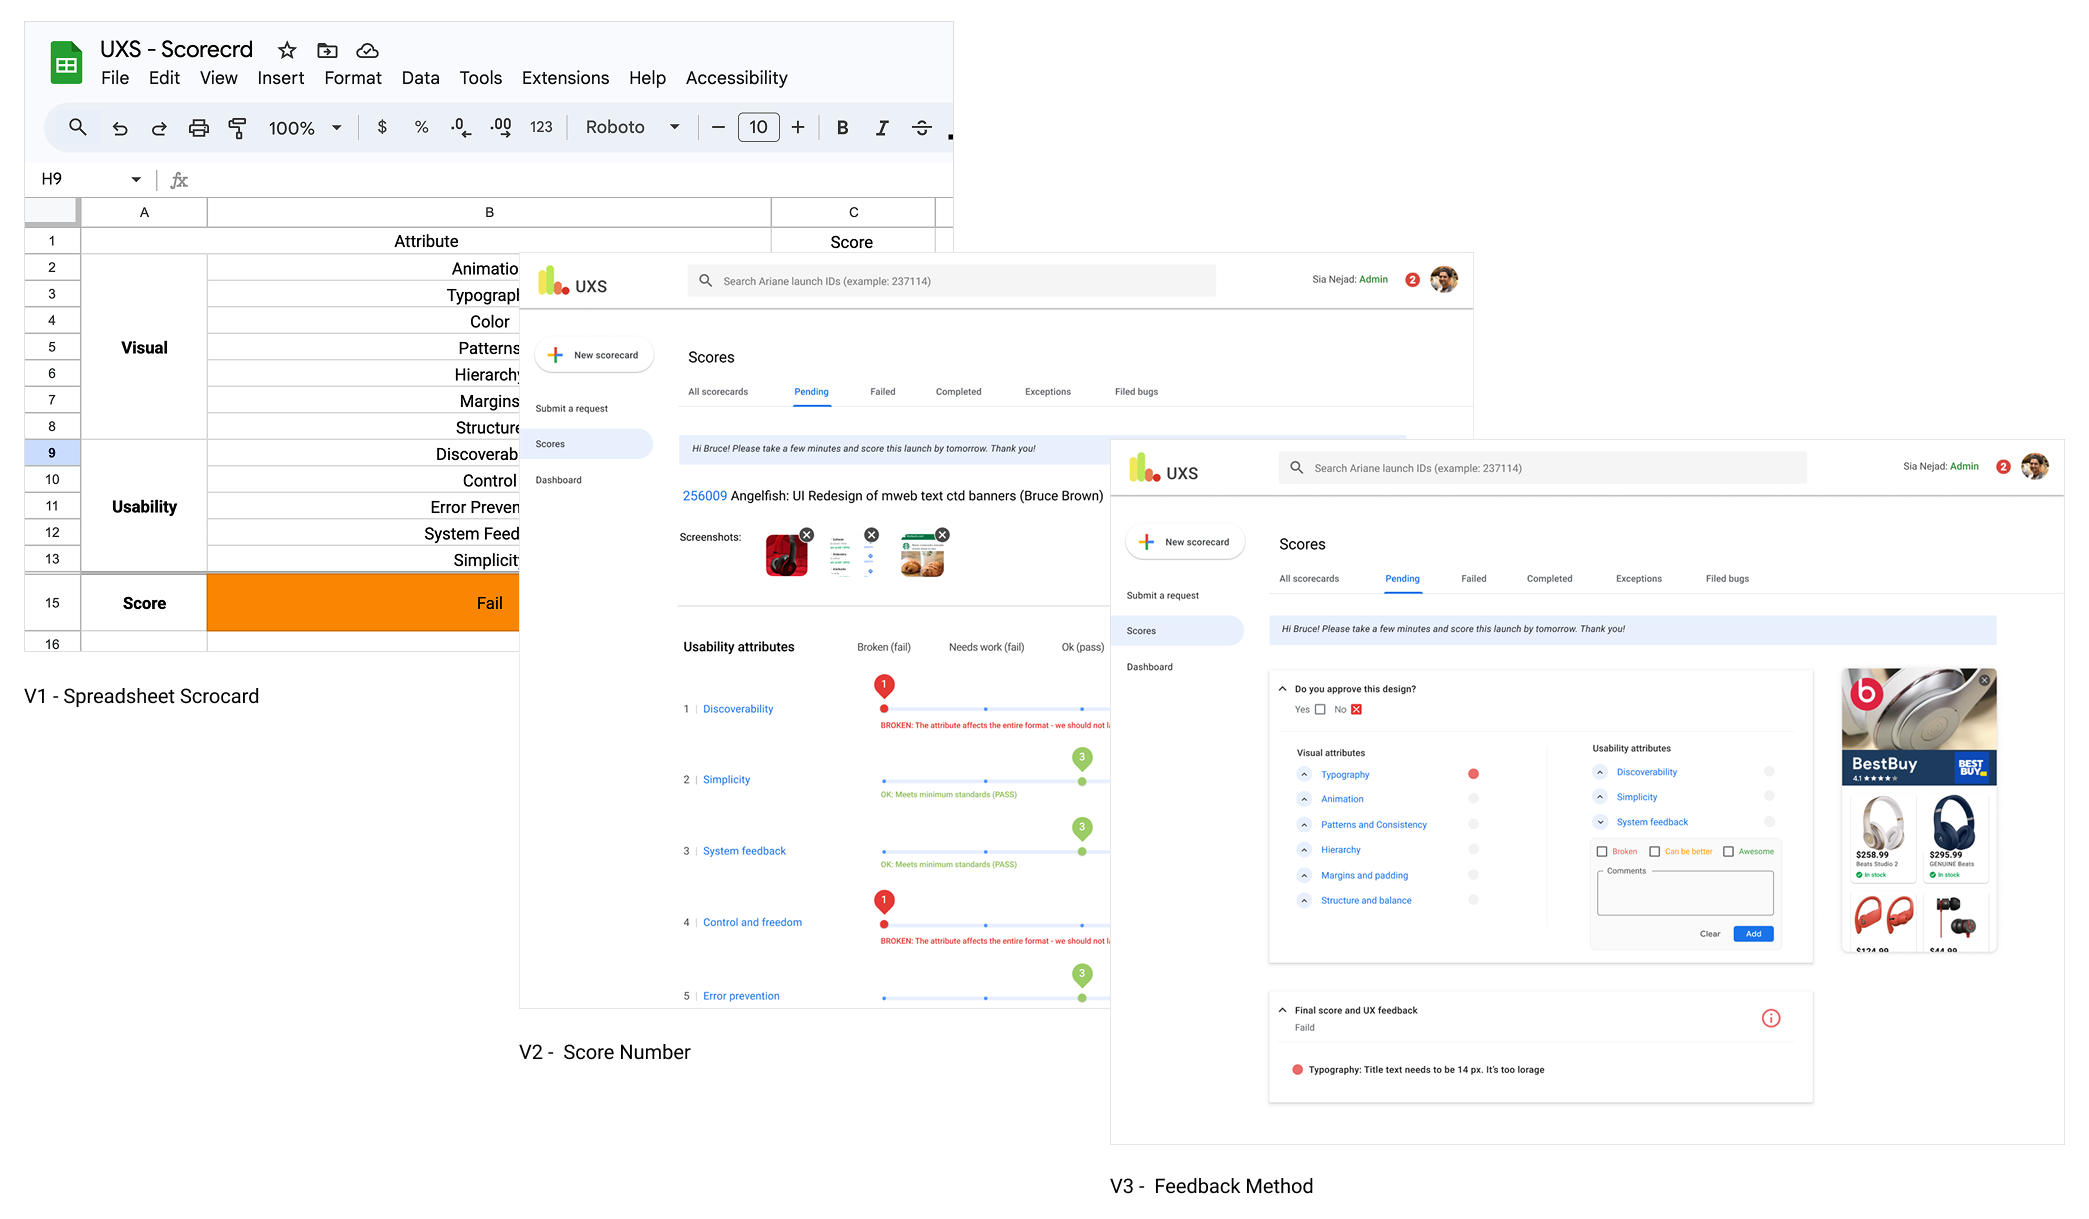
Design Evolution
Snapshots from low-fi flows to polished UI show how insights simplified tasks, removed redundant steps, and aligned terminology across teams.
The Impact: A New Standard for Quality
UX Scoring streamlined launch reviews, reduced friction between design and engineering, and raised product quality across teams.
Process Improvement
Clear, predictable approvals replaced last-minute surprises and escalations.
Approval flow clarity = fewer delays.
Business Results
Higher-quality launches correlated with stronger performance and satisfaction.
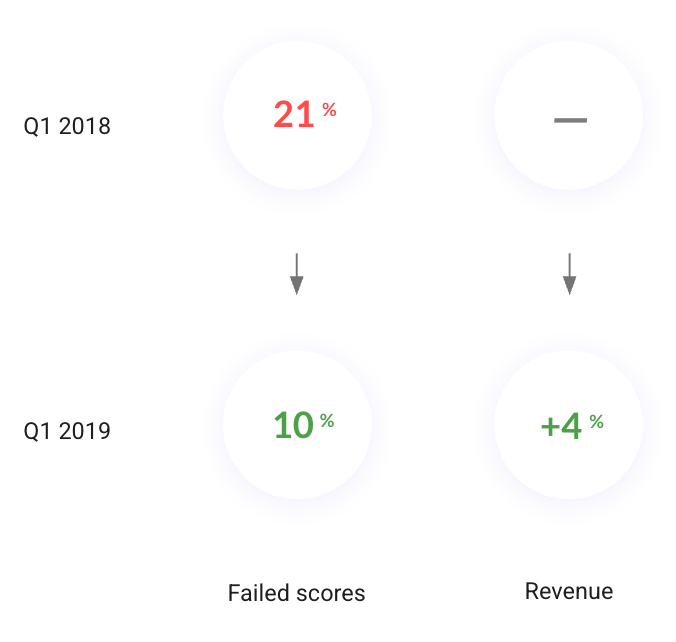
Want the exact figures and study design? Happy to share in a live walkthrough.
Retrospective & Lessons Learned
The Power of Phased Rollouts
Piloting with a small group let us learn fast, refine criteria, and build advocates before broader adoption.
Standardization vs. Autonomy
Standards set the bar; flexible application unlocked adoption and ownership across teams.
Proving Value with Data
Tracking outcomes post-launch sustained executive support and funding.
Roadmap
Next steps to scale UX Scoring over 12 months.
0–6 Months
- Integrate score requests into PRDs / issue trackers.
- Add role-based templates (PM / Eng / UX).
- Publish a clear “quality bar” with pass/fail examples.
6–12 Months
- Automate basic checks (contrast, tap targets, layout).
- Attach lint output + screenshot diffs to reports.
- Self-serve dashboard for score trends and rework.
Time-to-approval ↓
Rework after launch ↓
Reviewer coverage & adoption ↑